6. Engagement Campaign Reporting & Metrics*
The Customer Engagement Platform includes three reporting sections, with access depending on your subscription tier.
6.1 Overview
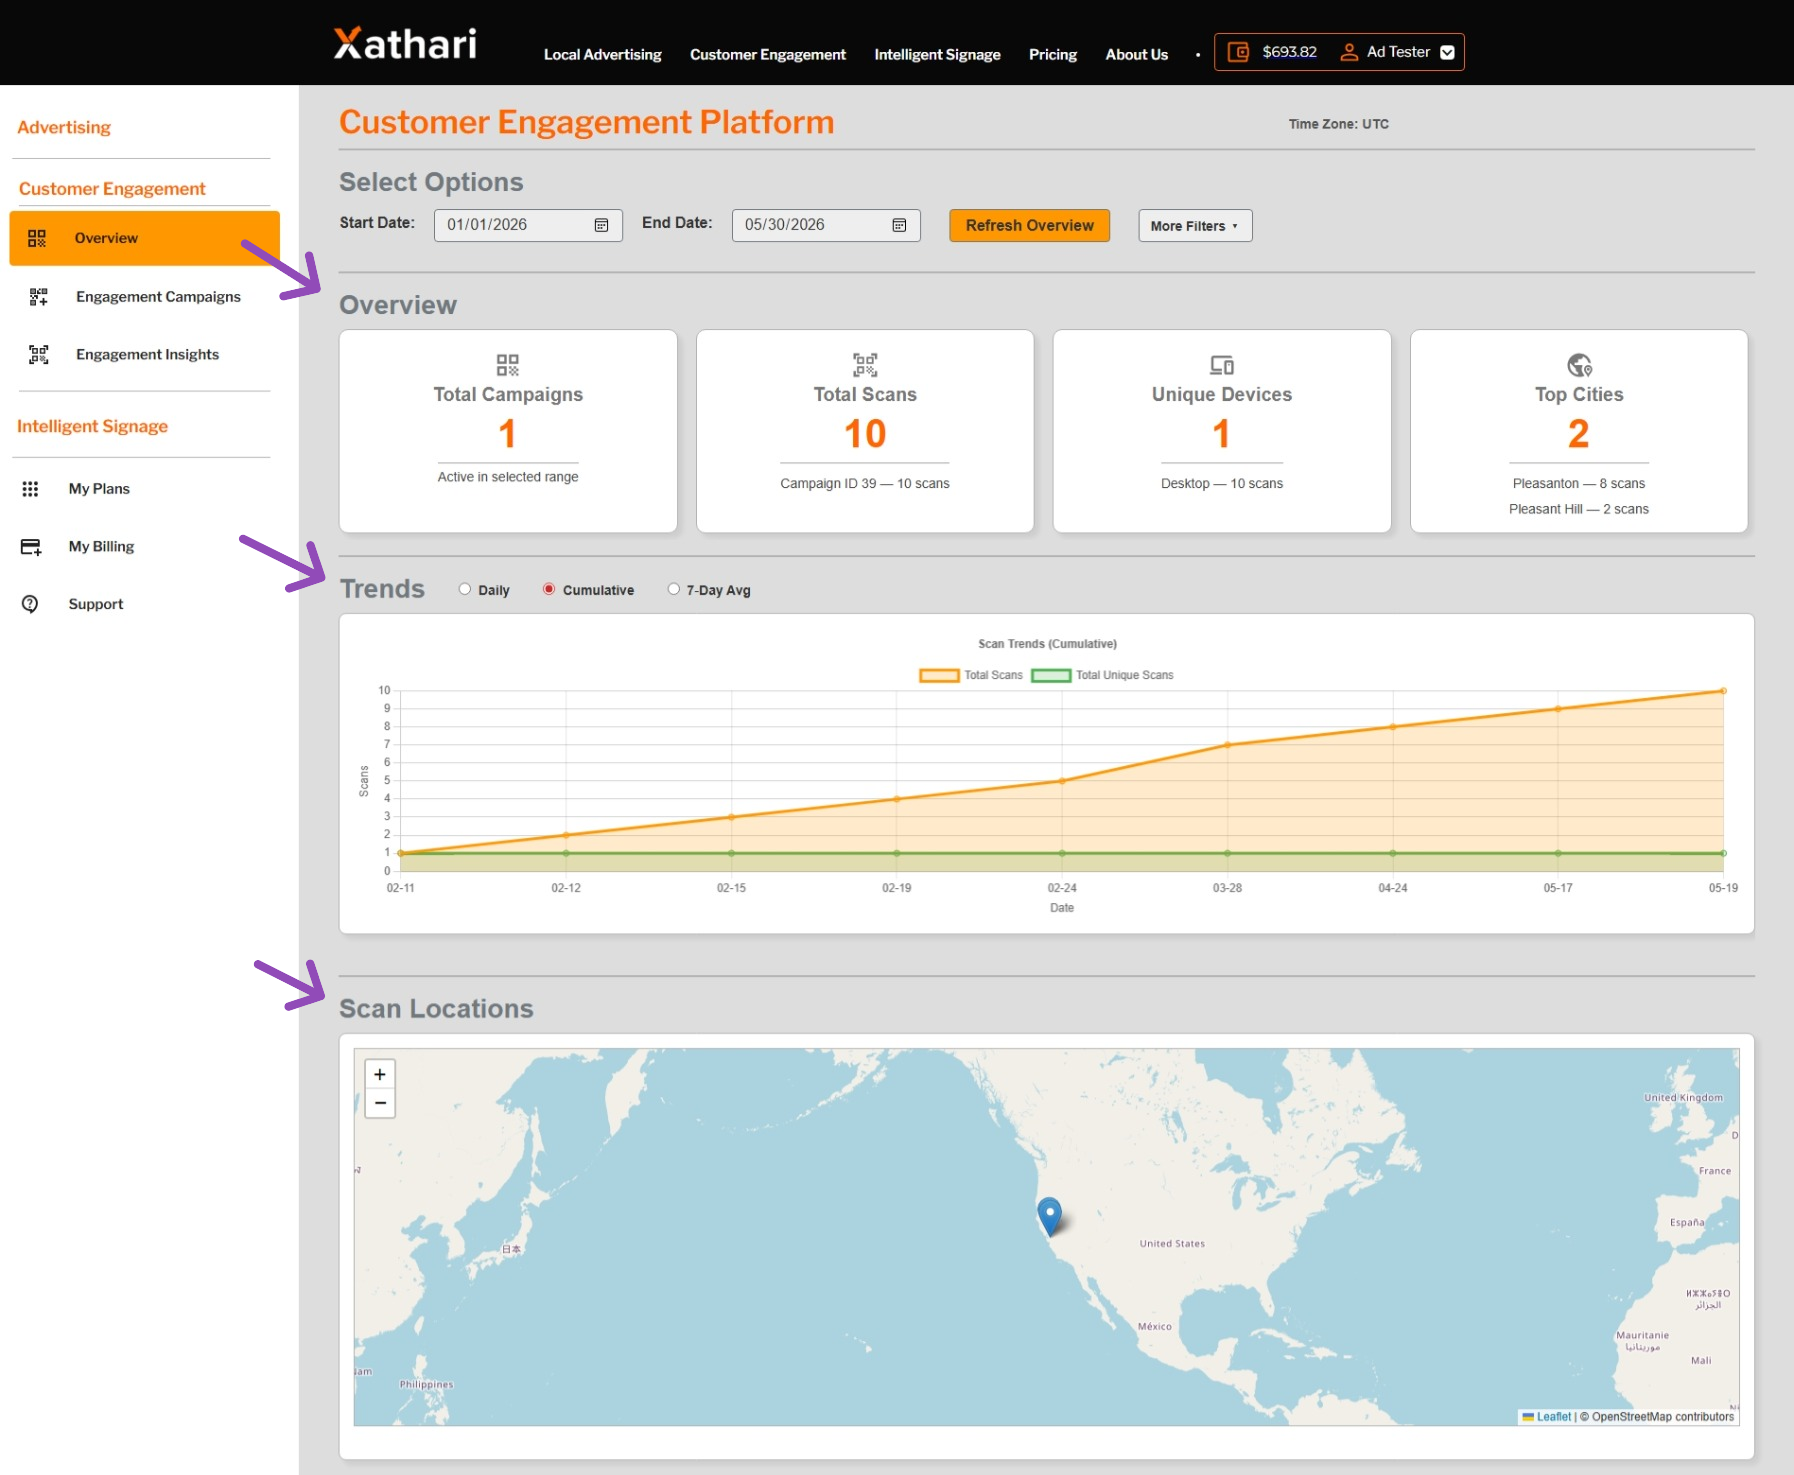
A high‑level snapshot of engagement activity.
** Demonstration data. The information shown in the example above uses sample content for illustrative purposes only. Actual data, features, and screen layouts may vary based on your subscription tier and account permissions. **
Select Options
Choose:
- Start Date
- End Date
- More Filters (Campaign, Device Type, UTM filters, Daily/Weekly/Monthly view)
Overview Cards
- Total Campaigns
- Total Scans (with top campaigns)
- Unique Devices (with device breakdown)
- Top Cities
Trends
A chart showing:
- Total Scans (yellow)
- Unique Scans (green)
With toggles for Daily, Cumulative, or 7‑Day Average.
Scan Locations
Interactive map with scan markers.
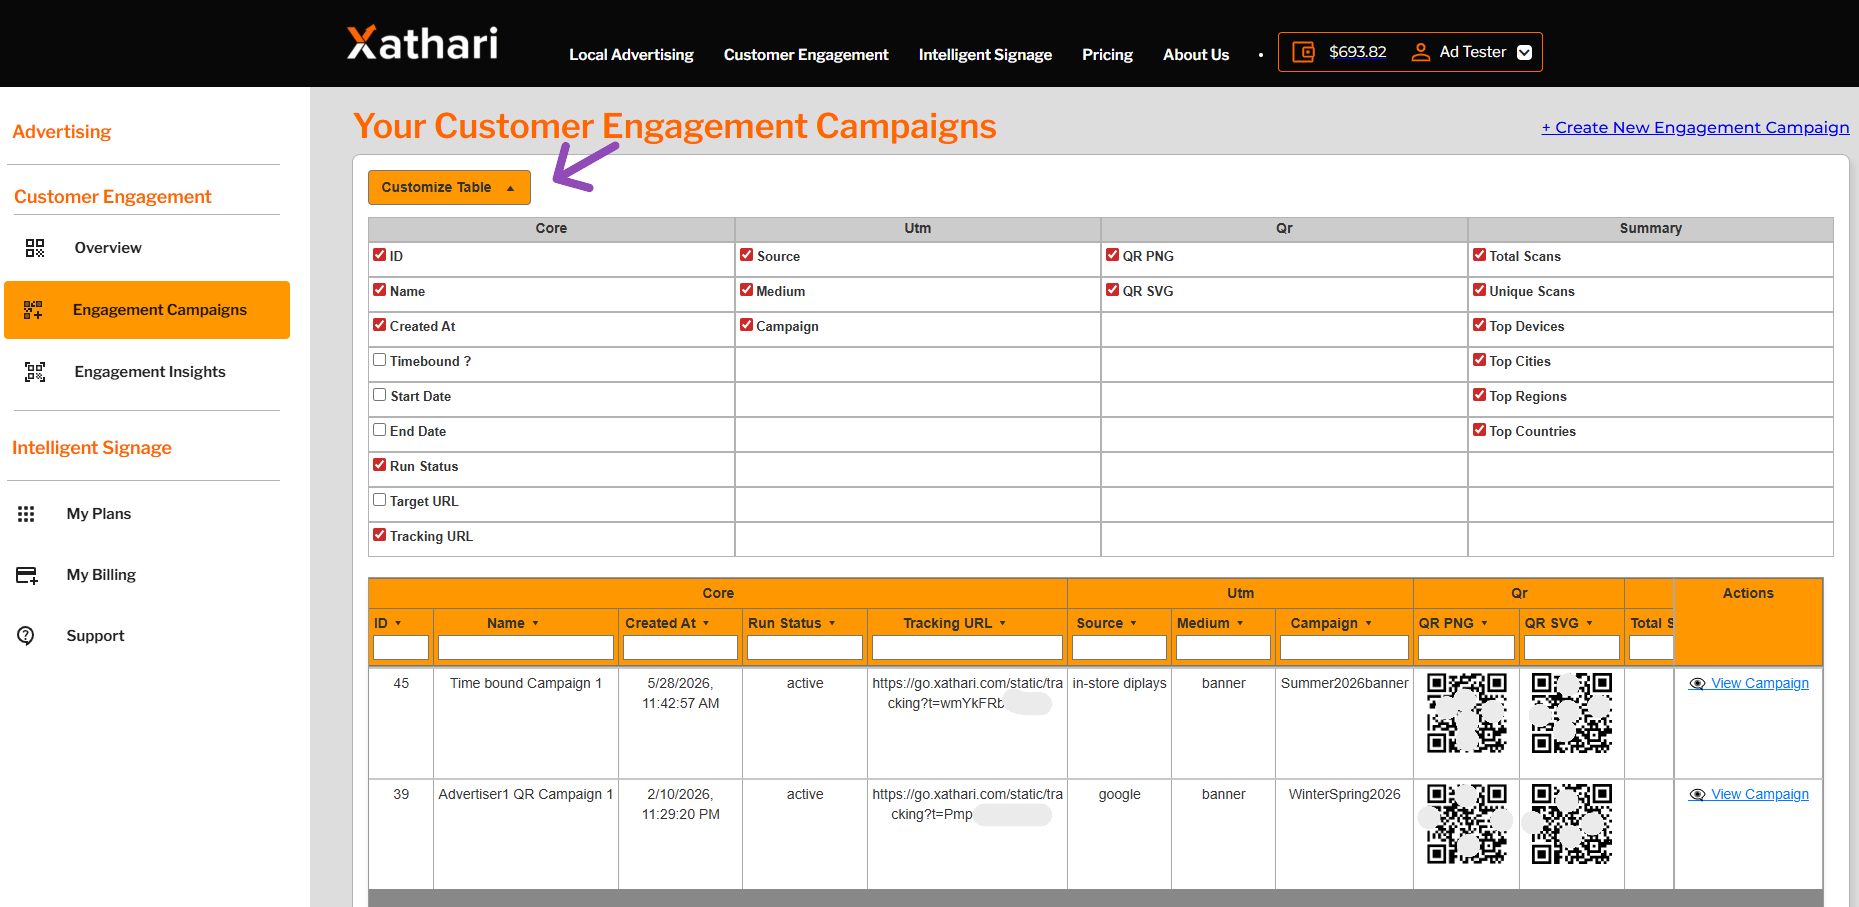
6.2 Engagement Campaigns Table
A detailed table of all campaigns.
Columns include:
Core
- ID
- Name
- Created At
- Time‑Bound?
- Start Date
- End Date
- Run Status
- Target URL
- Tracking URL
UTM
- Source
- Medium
- Campaign
QR
- QR PNG
- QR SVG
Summary
- Total Scans
- Unique Scans
- Top Devices
- Top Cities
- Top Regions
- Top Countries
Actions
- View Campaign
The table is fully customizable via Customize Table.
** Demonstration data. The information shown in the example above uses sample content for illustrative purposes only. Actual data, features, and screen layouts may vary based on your subscription tier and account permissions. **
6.3 Engagement Insights (powered by Google Analytics)
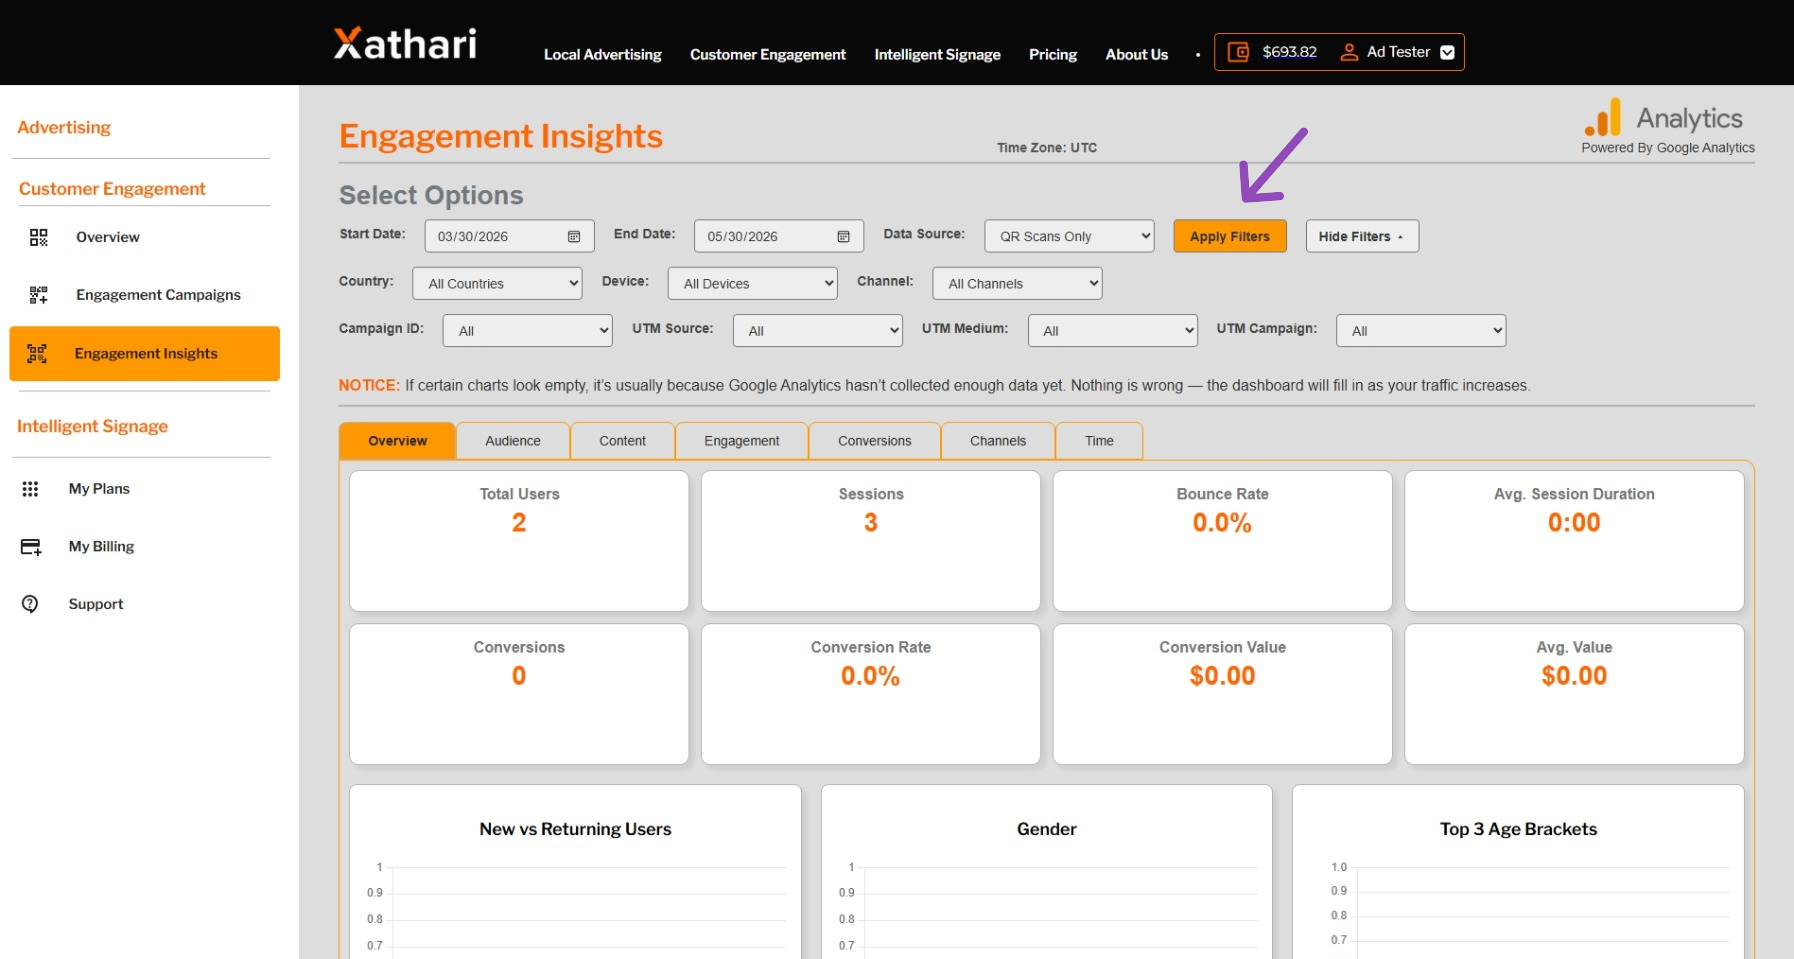
The Engagement Insights sub‑dashboard is the analytics powerhouse of the Customer Engagement Platform. It is powered by Google Analytics 4 (GA4) and BigQuery, and provides deep visibility into user behavior, demographics, content performance, conversions, and channel attribution.
** Demonstration data. The information shown in the example above uses sample content for illustrative purposes only. Actual data, features, and screen layouts may vary based on your subscription tier and account permissions. **
Depending on your CEP subscription tier, you may see all or only some of the tabs described below.
6.3.1 Select Options Panel
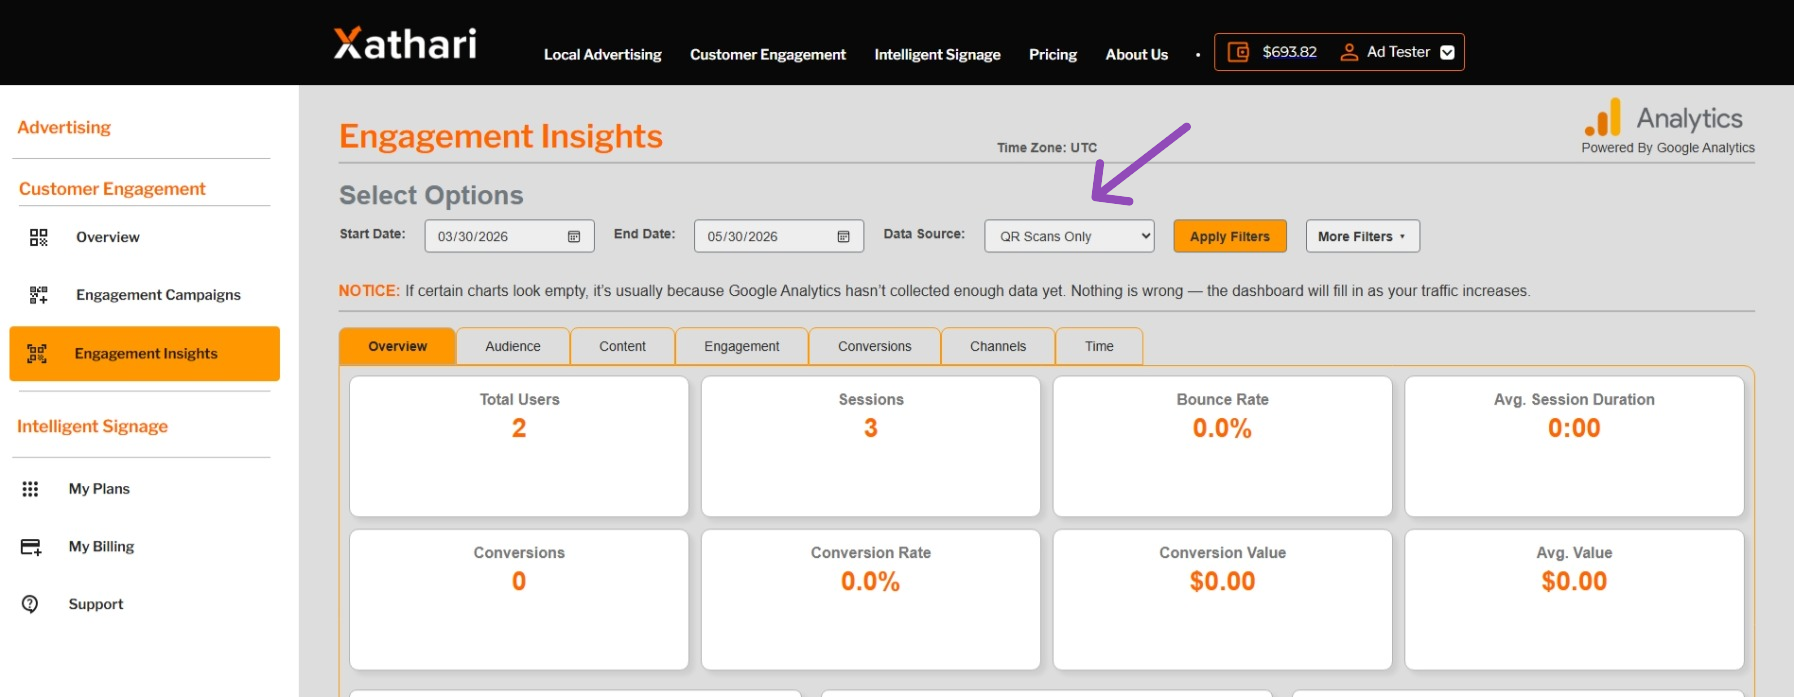
At the top of the Engagement Insights dashboard is the Select Options panel. This controls what data appears in all seven tabs.
Filters Available
- Start Date / End Date
- Data Source
- QR Scans Only — data from Xathari’s tracking URL
- Website Visits — Google analytics / GA4 data from your landing page
- More Filters
- Country
- Device Type
- Channel
- Campaign ID
- UTM Source
- UTM Medium
- UTM Campaign
After adjusting filters, click Apply Filters if the page does not refresh automatically.
** Demonstration data. The information shown in the example above uses sample content for illustrative purposes only. Actual data, features, and screen layouts may vary based on your subscription tier and account permissions. **
A notice reminds users that GA4 data may take time to populate, especially for demographics and smaller datasets. You might also see a spinner rotating - this indicates that your data that is available at the moment is being loaded.
Also, segment totals may be different than the overall totals because a single session can appear in multiple segments. For example, one session might include both mobile and desktop events, so it counts once in the total but once in each segment. This is expected behavior in analytics platforms.
6.3.2 Tabs Overview
The Engagement Insights dashboard contains seven tabs, each offering a different analytical perspective. Below is a complete breakdown of what each tab includes and how to interact with it.
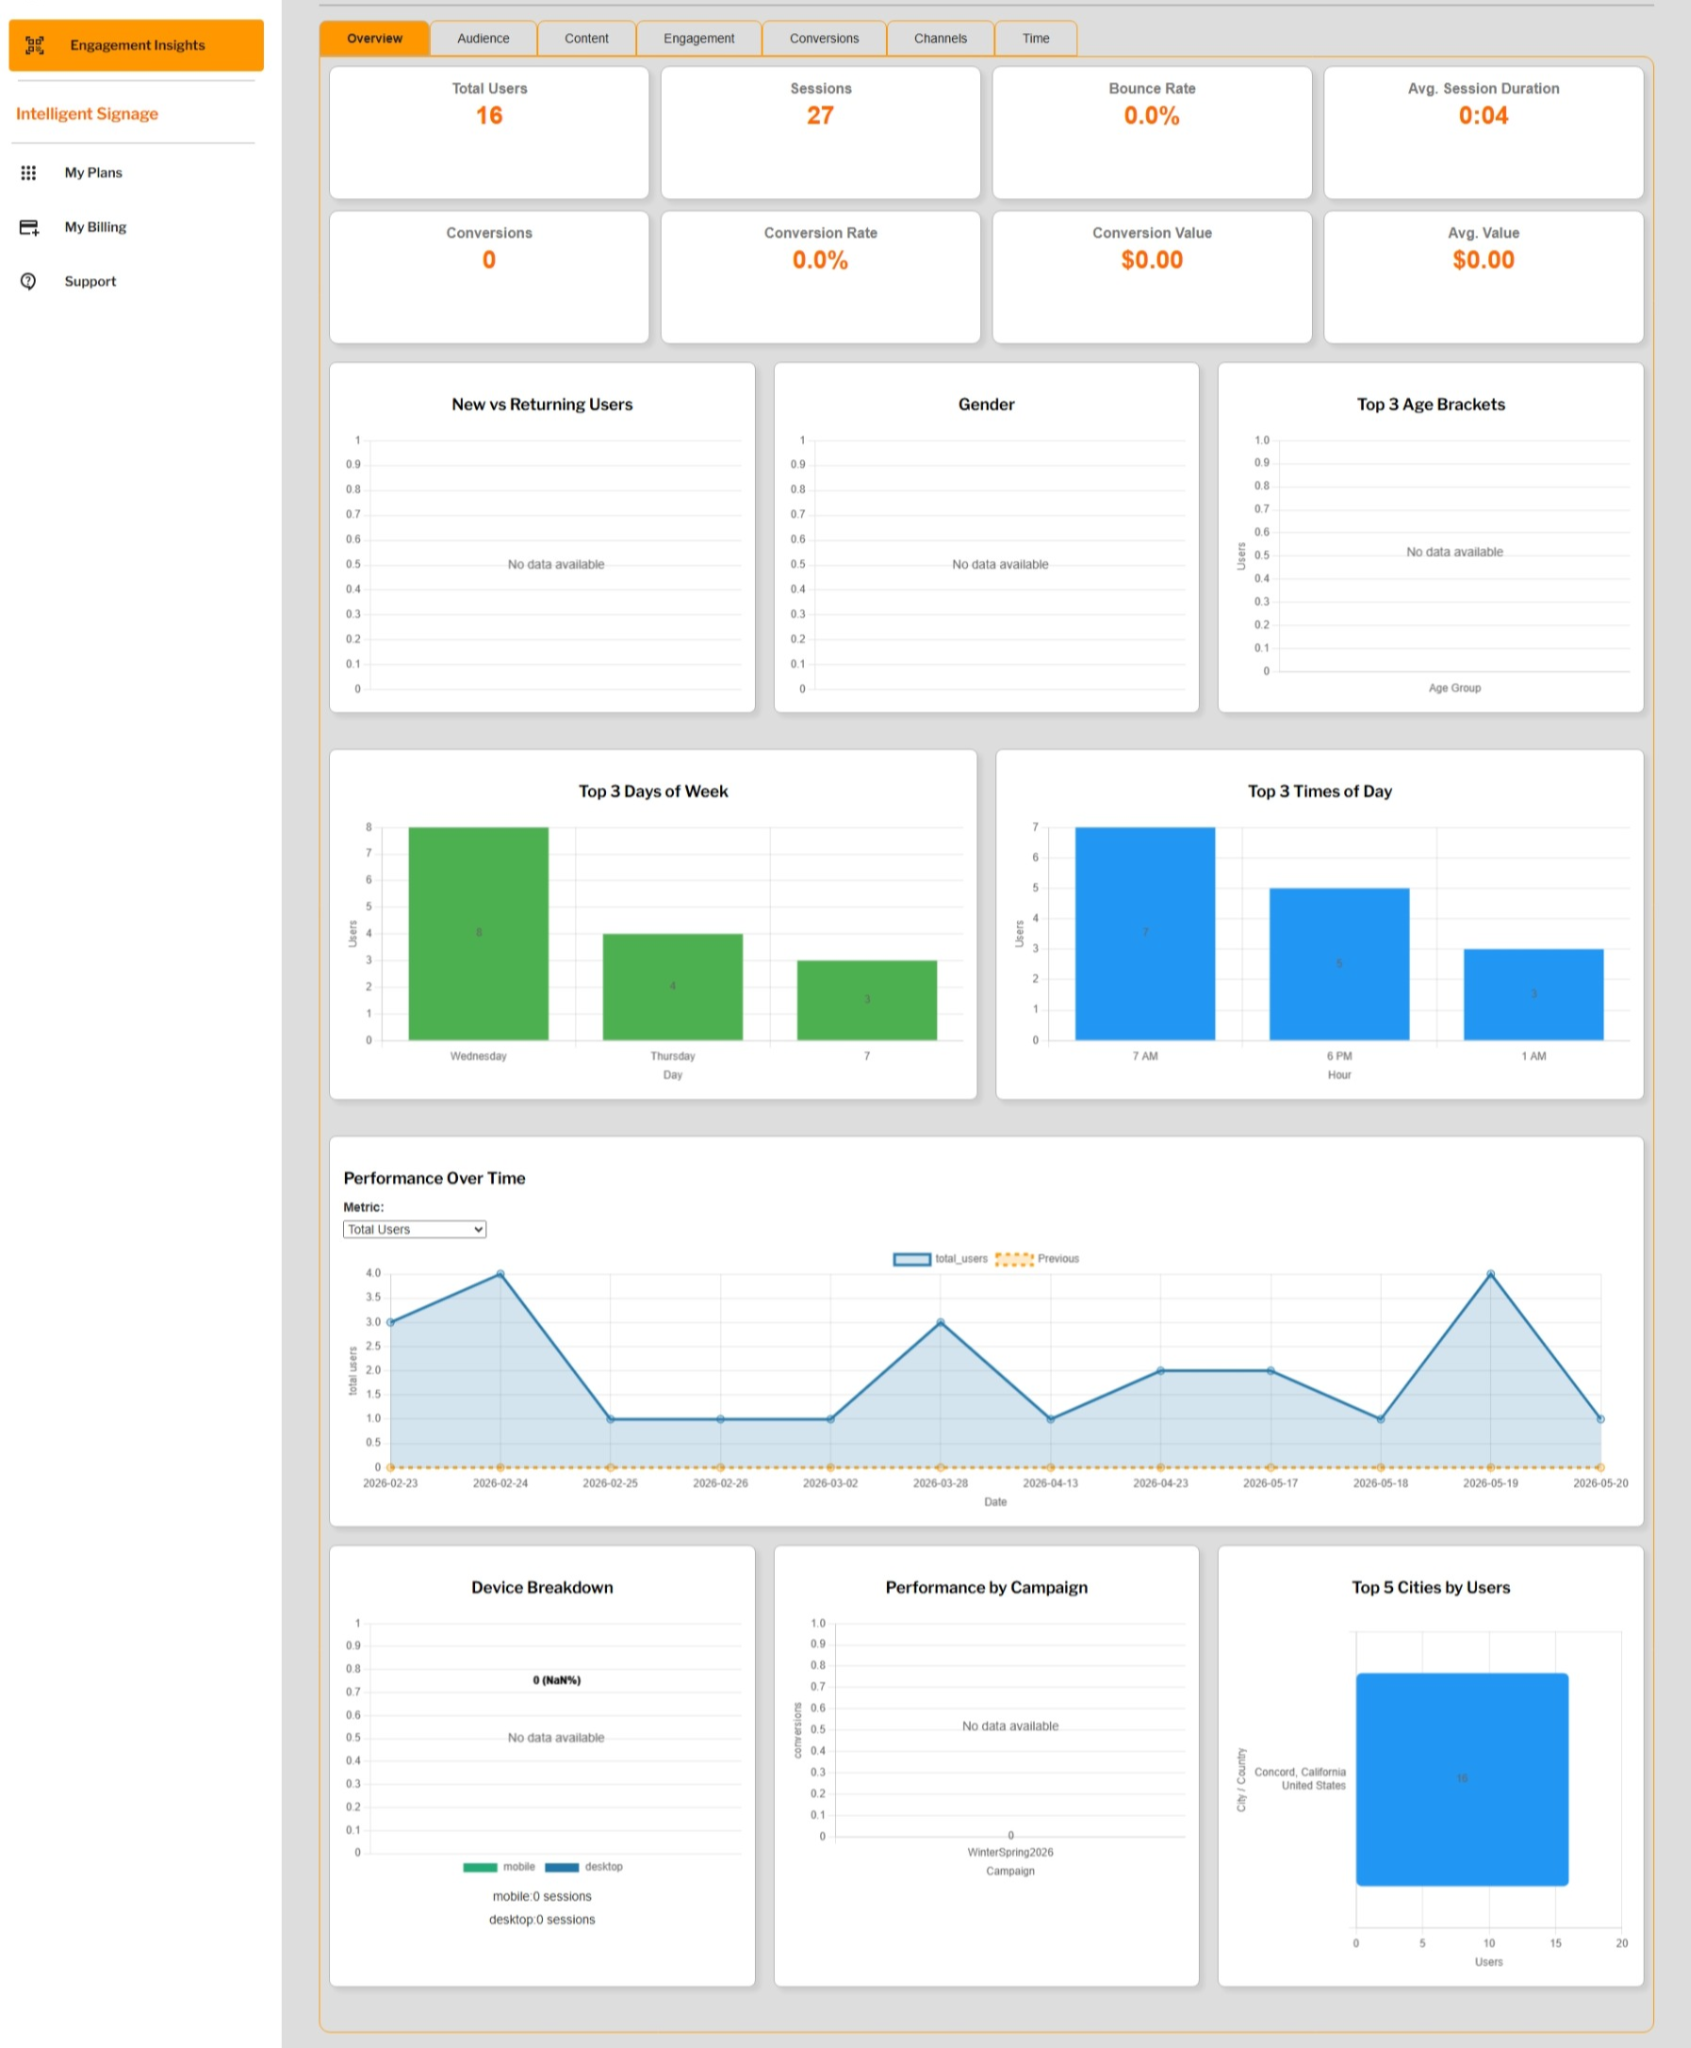
Tab 1 — Overview
This tab summarizes the most important GA4 metrics for your engagement campaigns.
Cards Displayed
- Total Users
- Sessions
- Bounce Rate (%)
- Average Session Duration
- Conversions
- Conversion Rate (%)
- Average Value
Charts
- New vs Returning Users
- Gender Breakdown
- Top 3 Age Brackets
- Top 3 Days of the Week
- Top 3 Times of Day
- Performance Over Time
- Dropdown to select metric (Sessions, Users, Bounce Rate, etc.)
- Device Breakdown
- Performance by Campaign
- Top 5 Cities by Users
This tab is ideal for a quick health check of your campaign performance.
** Demonstration data. The information shown in the example above uses sample content for illustrative purposes only. Actual data, features, and screen layouts may vary based on your subscription tier and account permissions. **
Tab 2 — Audience
This tab focuses on who your users are and when they engage.
Radio Buttons
- Demographics
- Day & Time
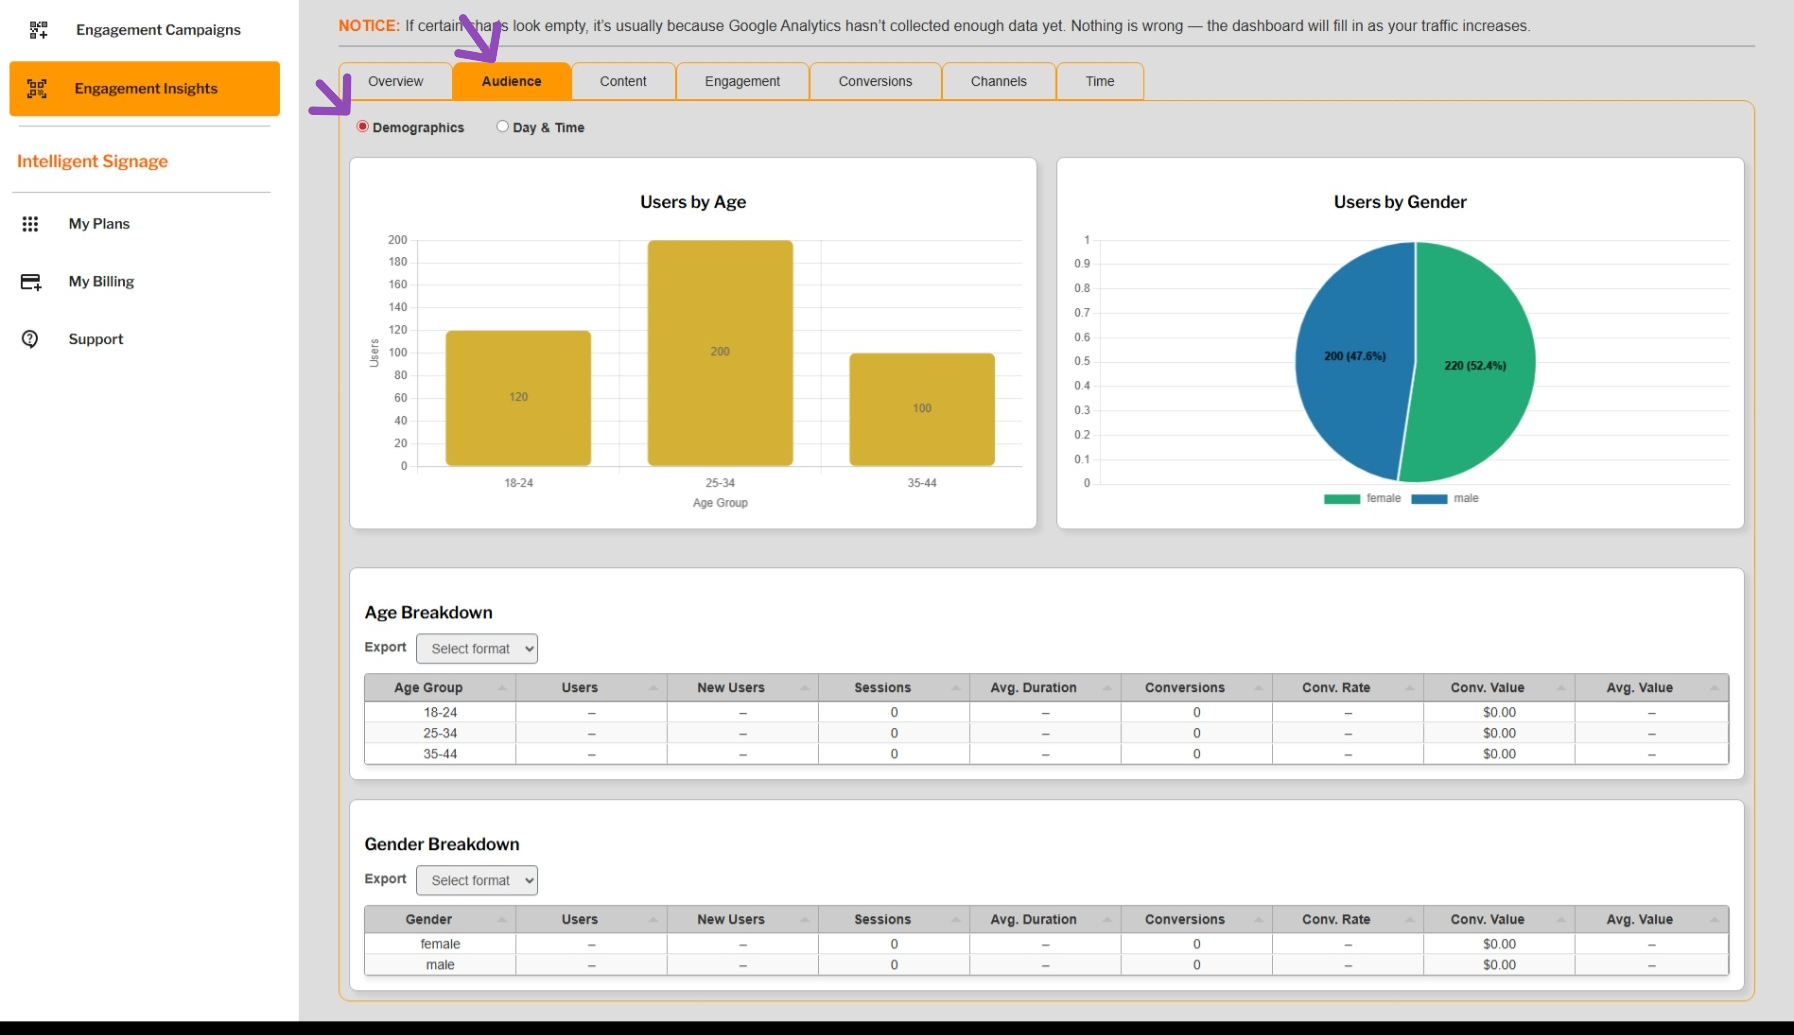
If “Demographics” is selected
You’ll see:
Charts
- Users by Age
- Users by Gender
Tables
- Age Breakdown Table
- Age Group
- Users
- New Users
- Sessions
- Avg Duration
- Conversions
- Conversion Rate
- Conversion Value
- Avg Value
- Gender Breakdown Table
- Gender
- Users
- New Users
- Sessions
- Avg Duration
- Conversions
- Conversion Rate
- Conversion Value
- Avg Value
** Demonstration data. The information shown in the example above uses sample content for illustrative purposes only. Actual data, features, and screen layouts may vary based on your subscription tier and account permissions. **
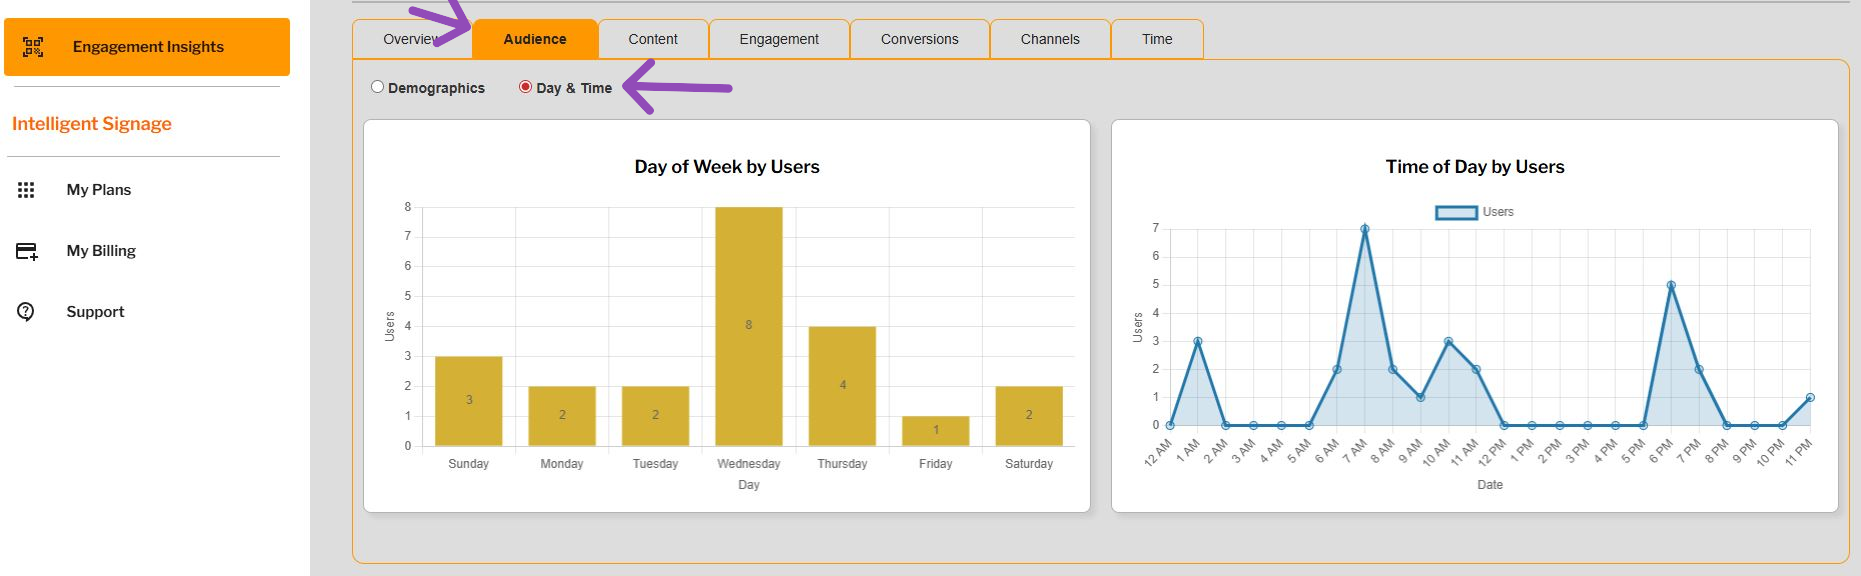
If “Day & Time” is selected
You’ll see:
Charts
- Day of Week by Users (bar chart)
- Time of Day by Users (line chart)
This tab helps you understand who your audience is and when they are most active.
** Demonstration data. The information shown in the example above uses sample content for illustrative purposes only. Actual data, features, and screen layouts may vary based on your subscription tier and account permissions. **
Tab 3 — Content
This tab analyzes how users interact with your landing page content.
Radio Buttons
- Content
- Landing Pages
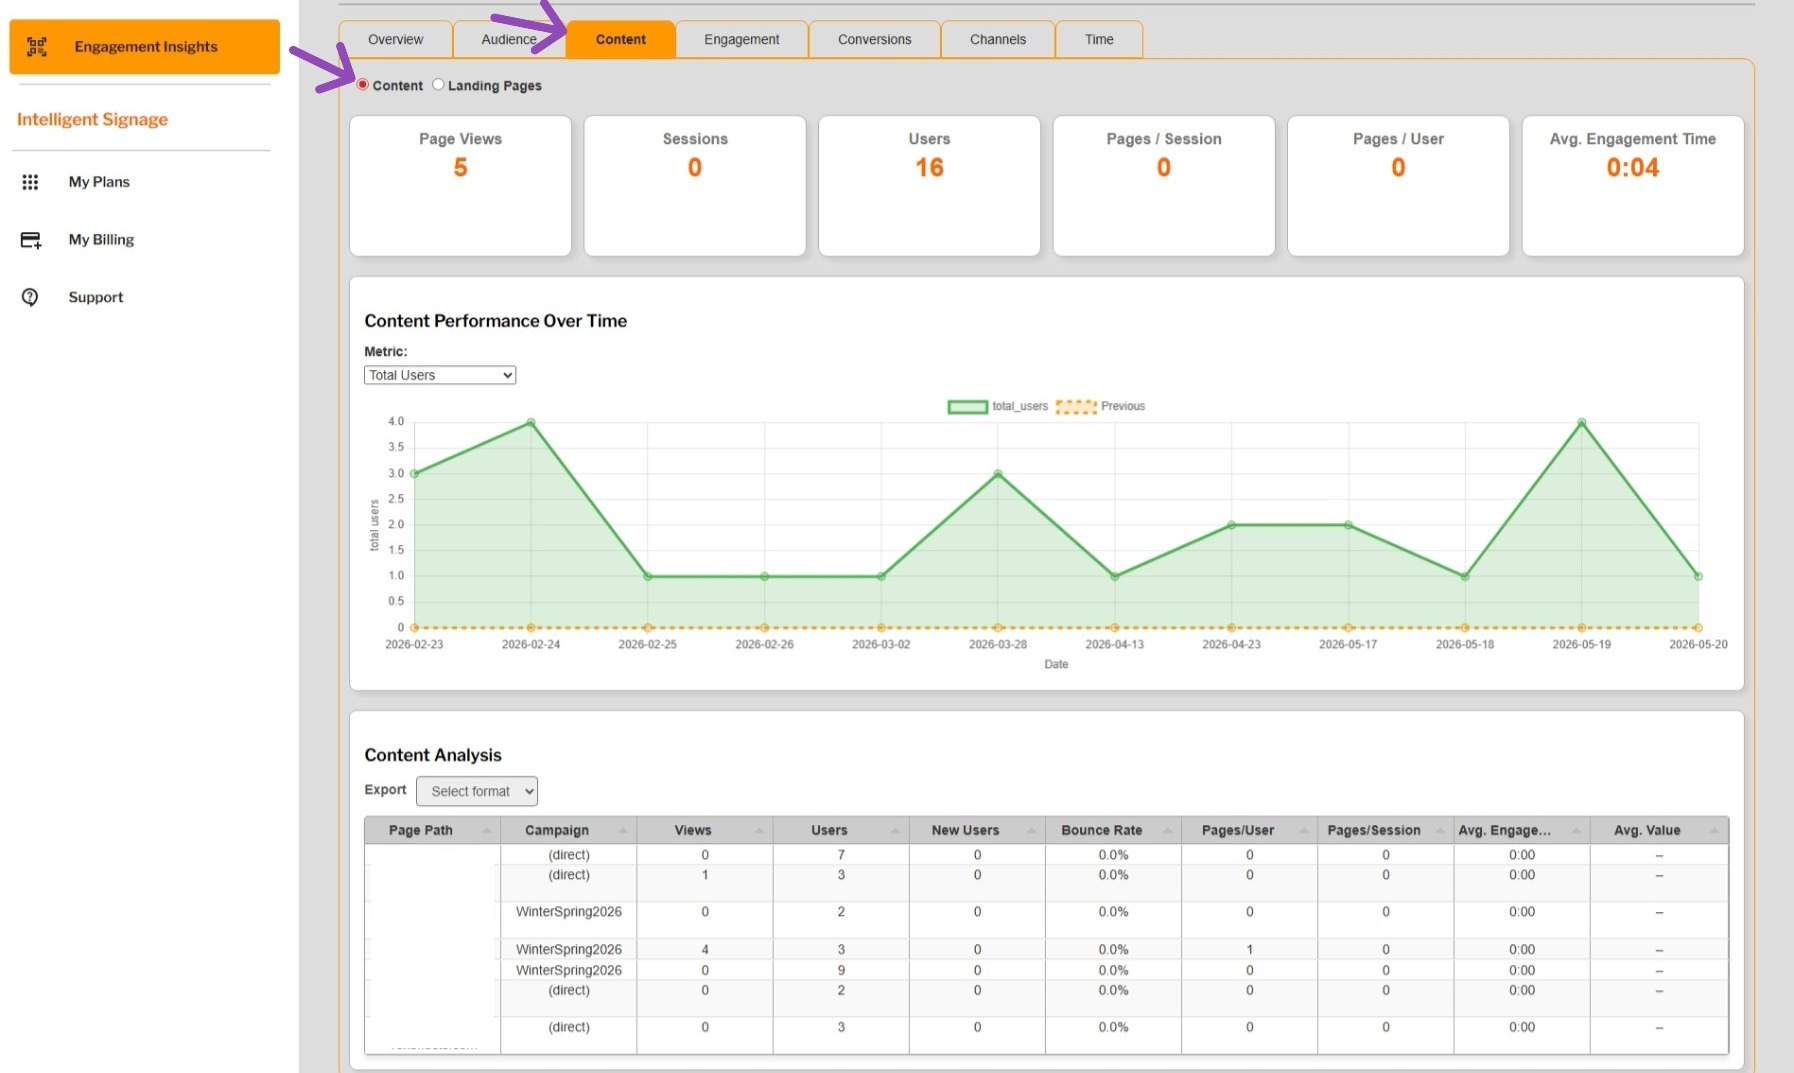
If “Content” is selected
Cards
- Page Views
- Sessions
- Users
- Pages / Session
- Pages / User
- Average Engagement Time
Charts
- Content Performance Over Time
- Metric selector (Sessions, Users, Bounce Rate, etc.)
Table
- Content Analysis Table
- Page Path
- Campaign
- Views
- Users
- New Users
- Bounce Rate
- Pages/User
- Pages/Session
- Avg Engagement
- Avg Value
** Demonstration data. The information shown in the example above uses sample content for illustrative purposes only. Actual data, features, and screen layouts may vary based on your subscription tier and account permissions. **
If “Landing Pages” is selected
Charts
- Top Landing Pages (Pareto)
- Landing Pages by Sessions & Conversions (bubble chart)
Table
- Landing Pages Analysis Table
- Page
- Campaign
- Sessions
- Bounce Rate
- Conversions
- Conversion Rate
- Conversion Value
- Users
- New Users
- Pages/Session
- Avg Value
This tab is essential for understanding which pages perform best and why.

** Demonstration data. The information shown in the example above uses sample content for illustrative purposes only. Actual data, features, and screen layouts may vary based on your subscription tier and account permissions. **
Tab 4 — Engagement
This tab focuses on events, interactions, and site search behavior.
Radio Buttons
- Events
- Interactions
- Site Search
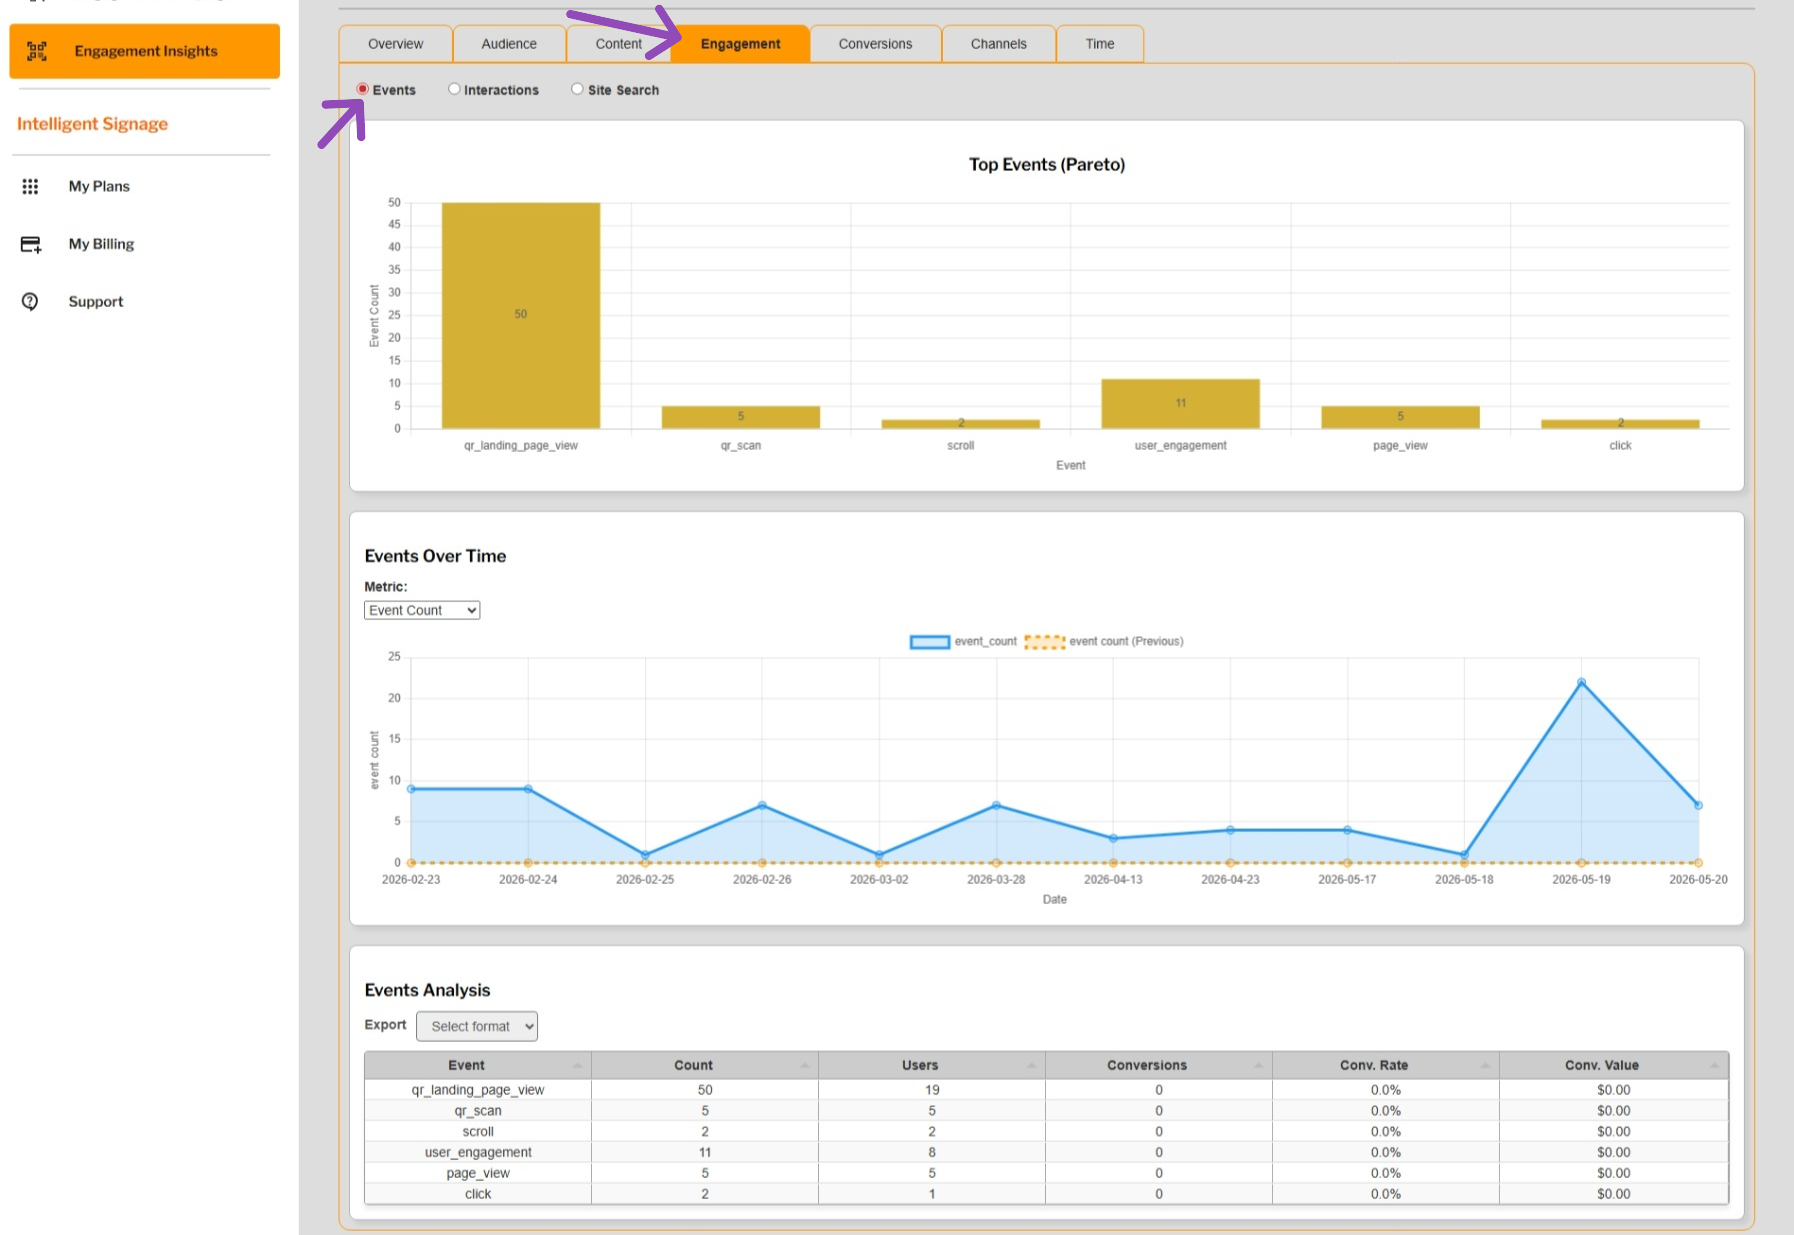
If “Events” is selected
Charts
- Top Events (Pareto)
- Events Over Time
- Metric selector (Event Count, Event Value, Avg Value, Events/User)
Table
- Event
- Count
- Users
- Conversions
- Conversion Rate
- Conversion Value
** Demonstration data. The information shown in the example above uses sample content for illustrative purposes only. Actual data, features, and screen layouts may vary based on your subscription tier and account permissions. **
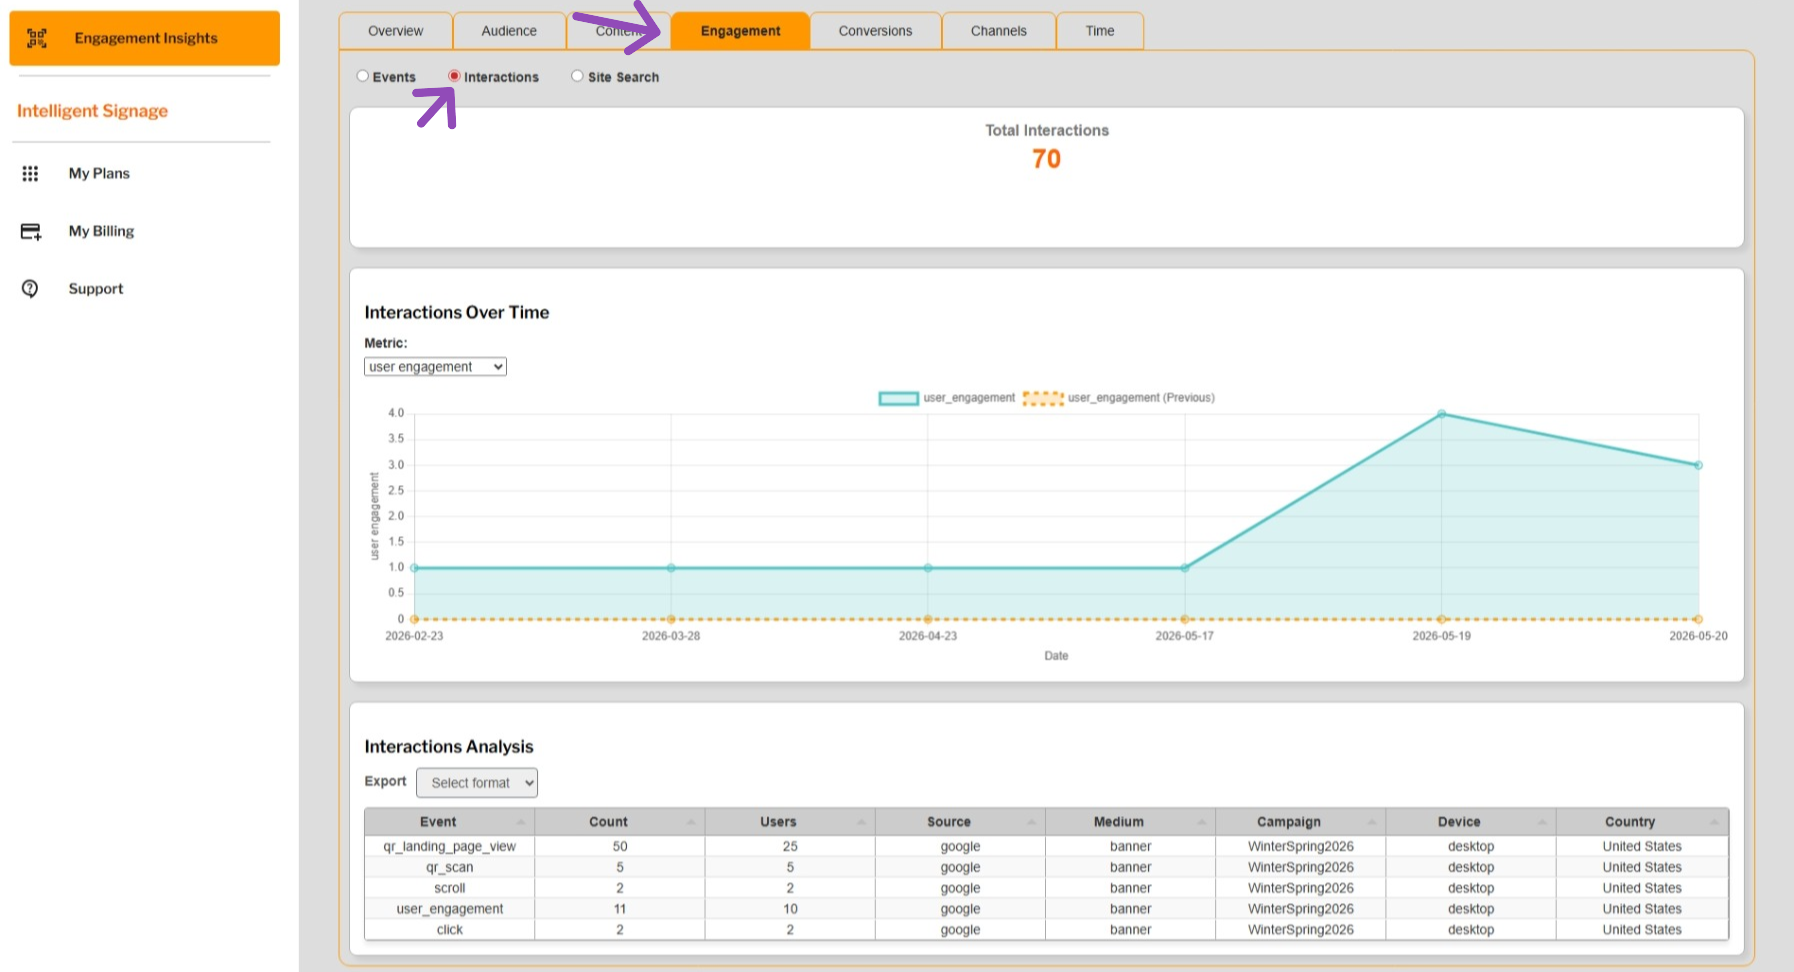
If “Interactions” is selected
Cards
- Total Interactions
Charts
- Interactions Over Time
- Metric selector (auto‑populated based on Data Source)
Table
- Event
- Count
- Users
- Source
- Medium
- Campaign
- Device
- Country
** Demonstration data. The information shown in the example above uses sample content for illustrative purposes only. Actual data, features, and screen layouts may vary based on your subscription tier and account permissions. **
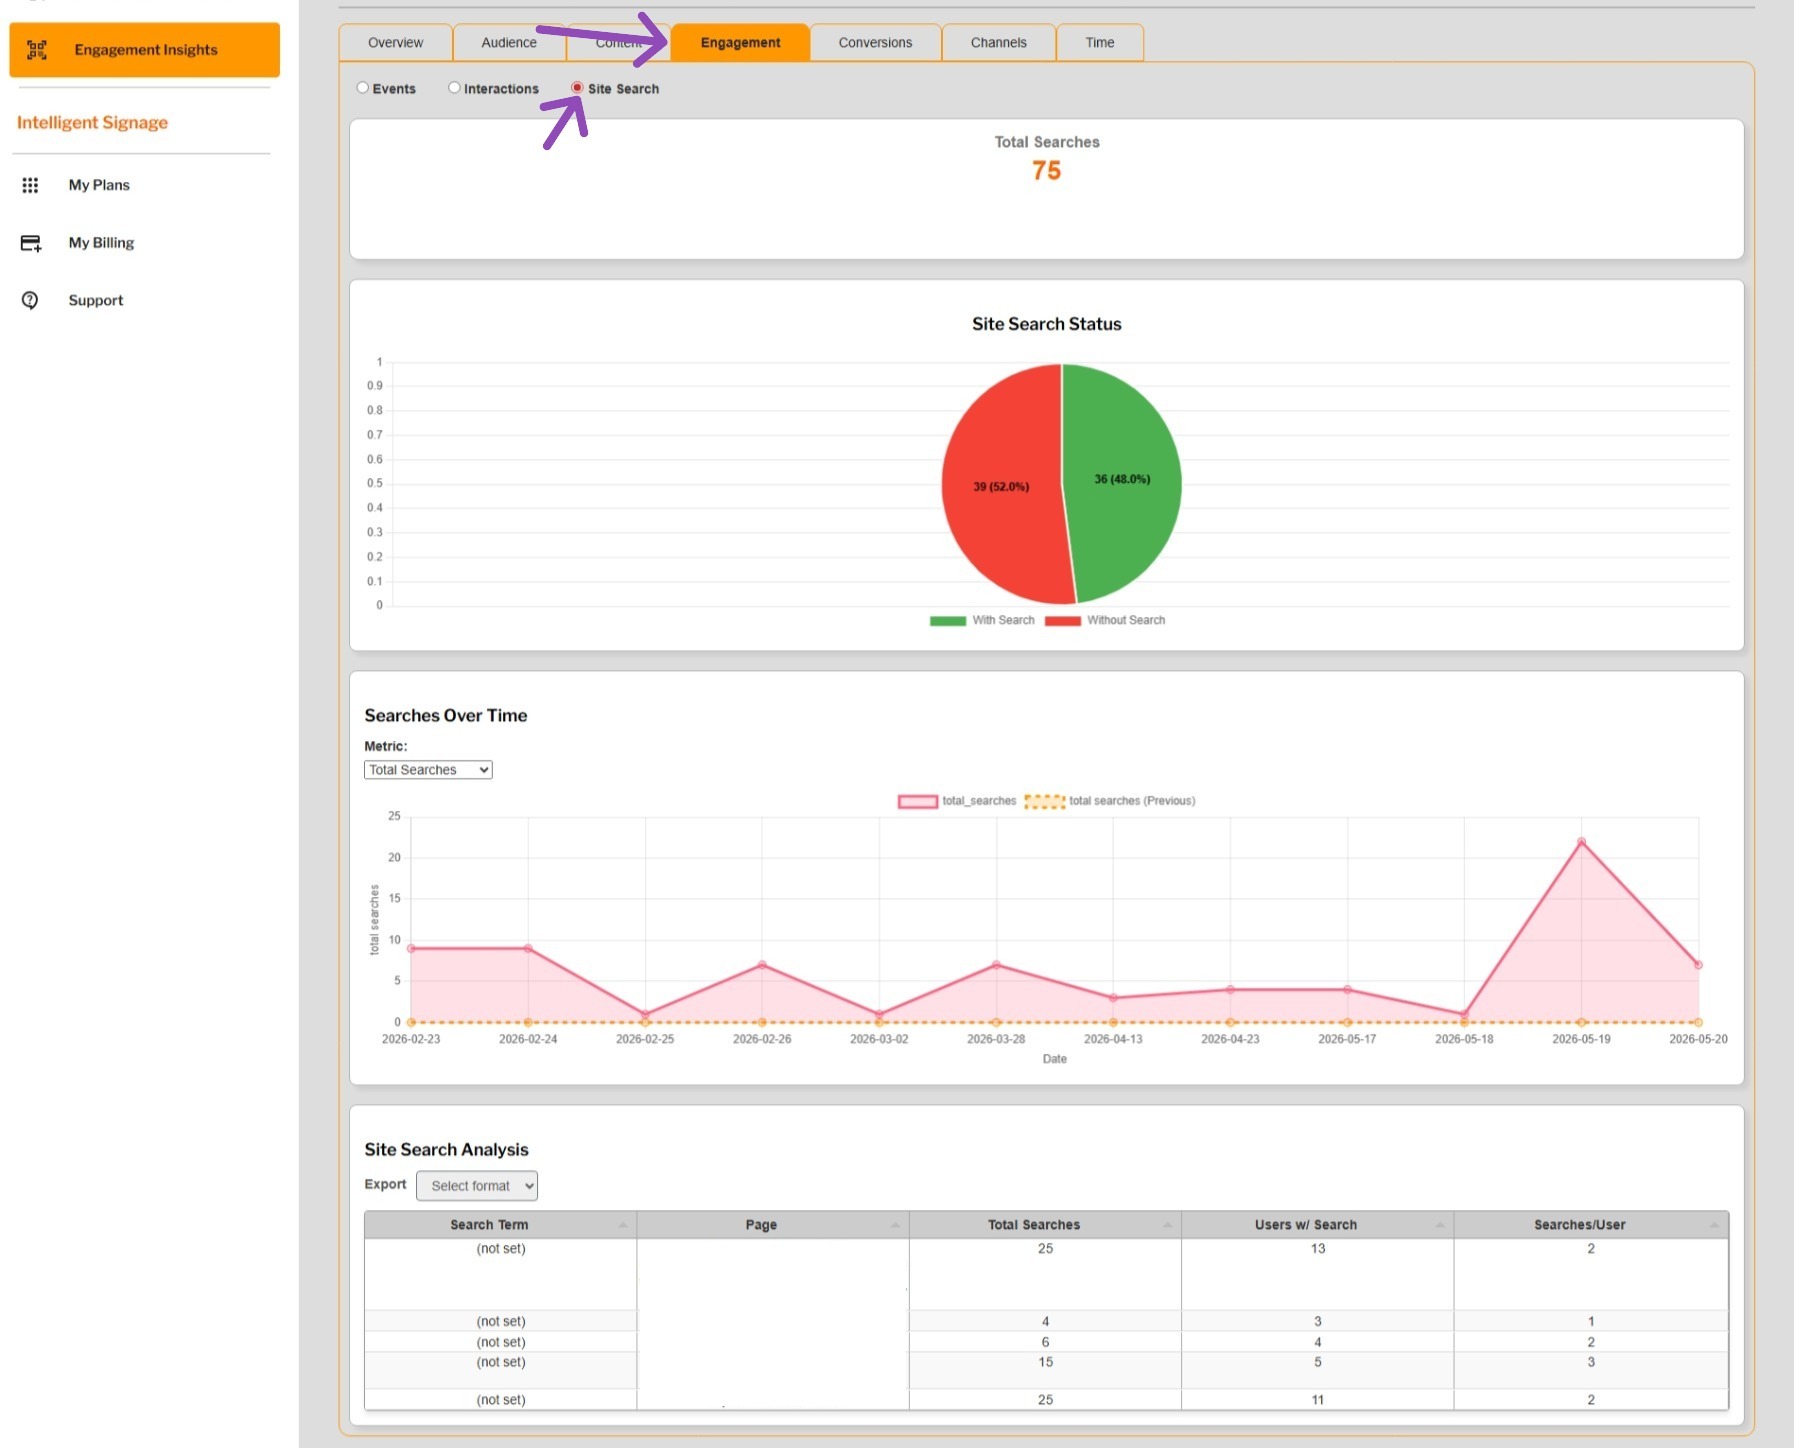
If “Site Search” is selected
Cards
- Total Searches
Charts
- Site Search Status (pie chart)
- Searches Over Time
- Metric selector (Total Searches, Users w/ Search, Searches/User)
Table
- Search Term
- Page
- Total Searches
- Users w/ Search
- Searches/User
This tab is ideal for understanding how users interact with your content and what they look for.
** Demonstration data. The information shown in the example above uses sample content for illustrative purposes only. Actual data, features, and screen layouts may vary based on your subscription tier and account permissions. **
Tab 5 — Conversions
This tab focuses on key events and ecommerce performance.
Radio Buttons
- Key Events
- Ecommerce
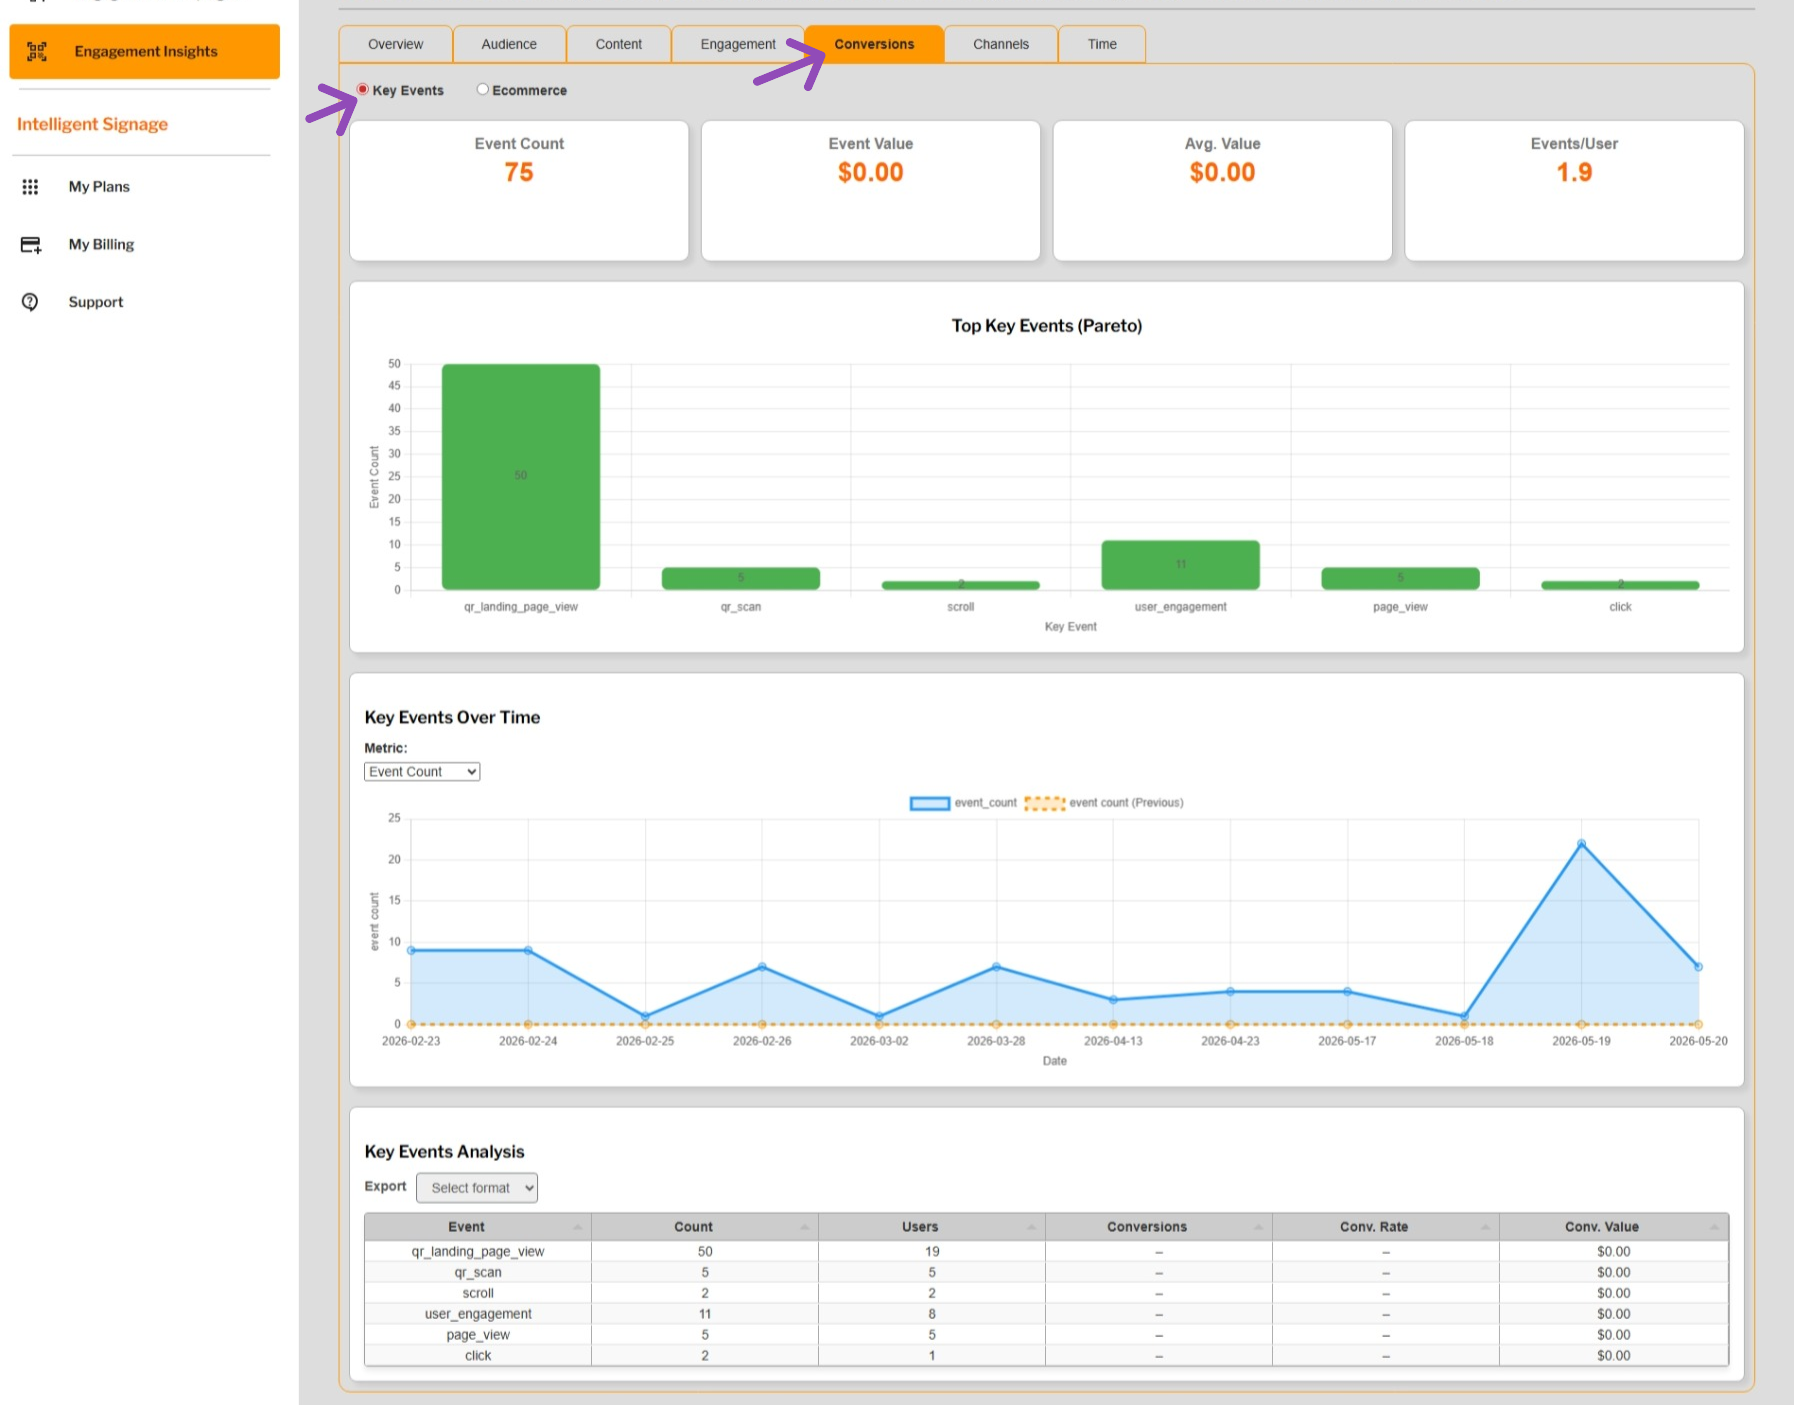
If “Key Events” is selected
Cards
- Event Count
- Event Value
- Average Value
- Events/User
Charts
- Top Key Events (Pareto)
- Key Events Over Time
- Metric selector (Event Count, Event Value, Avg Value, Events/User)
Table
- Event
- Count
- Users
- Conversions
- Conversion Rate
- Conversion Value
** Demonstration data. The information shown in the example above uses sample content for illustrative purposes only. Actual data, features, and screen layouts may vary based on your subscription tier and account permissions. **
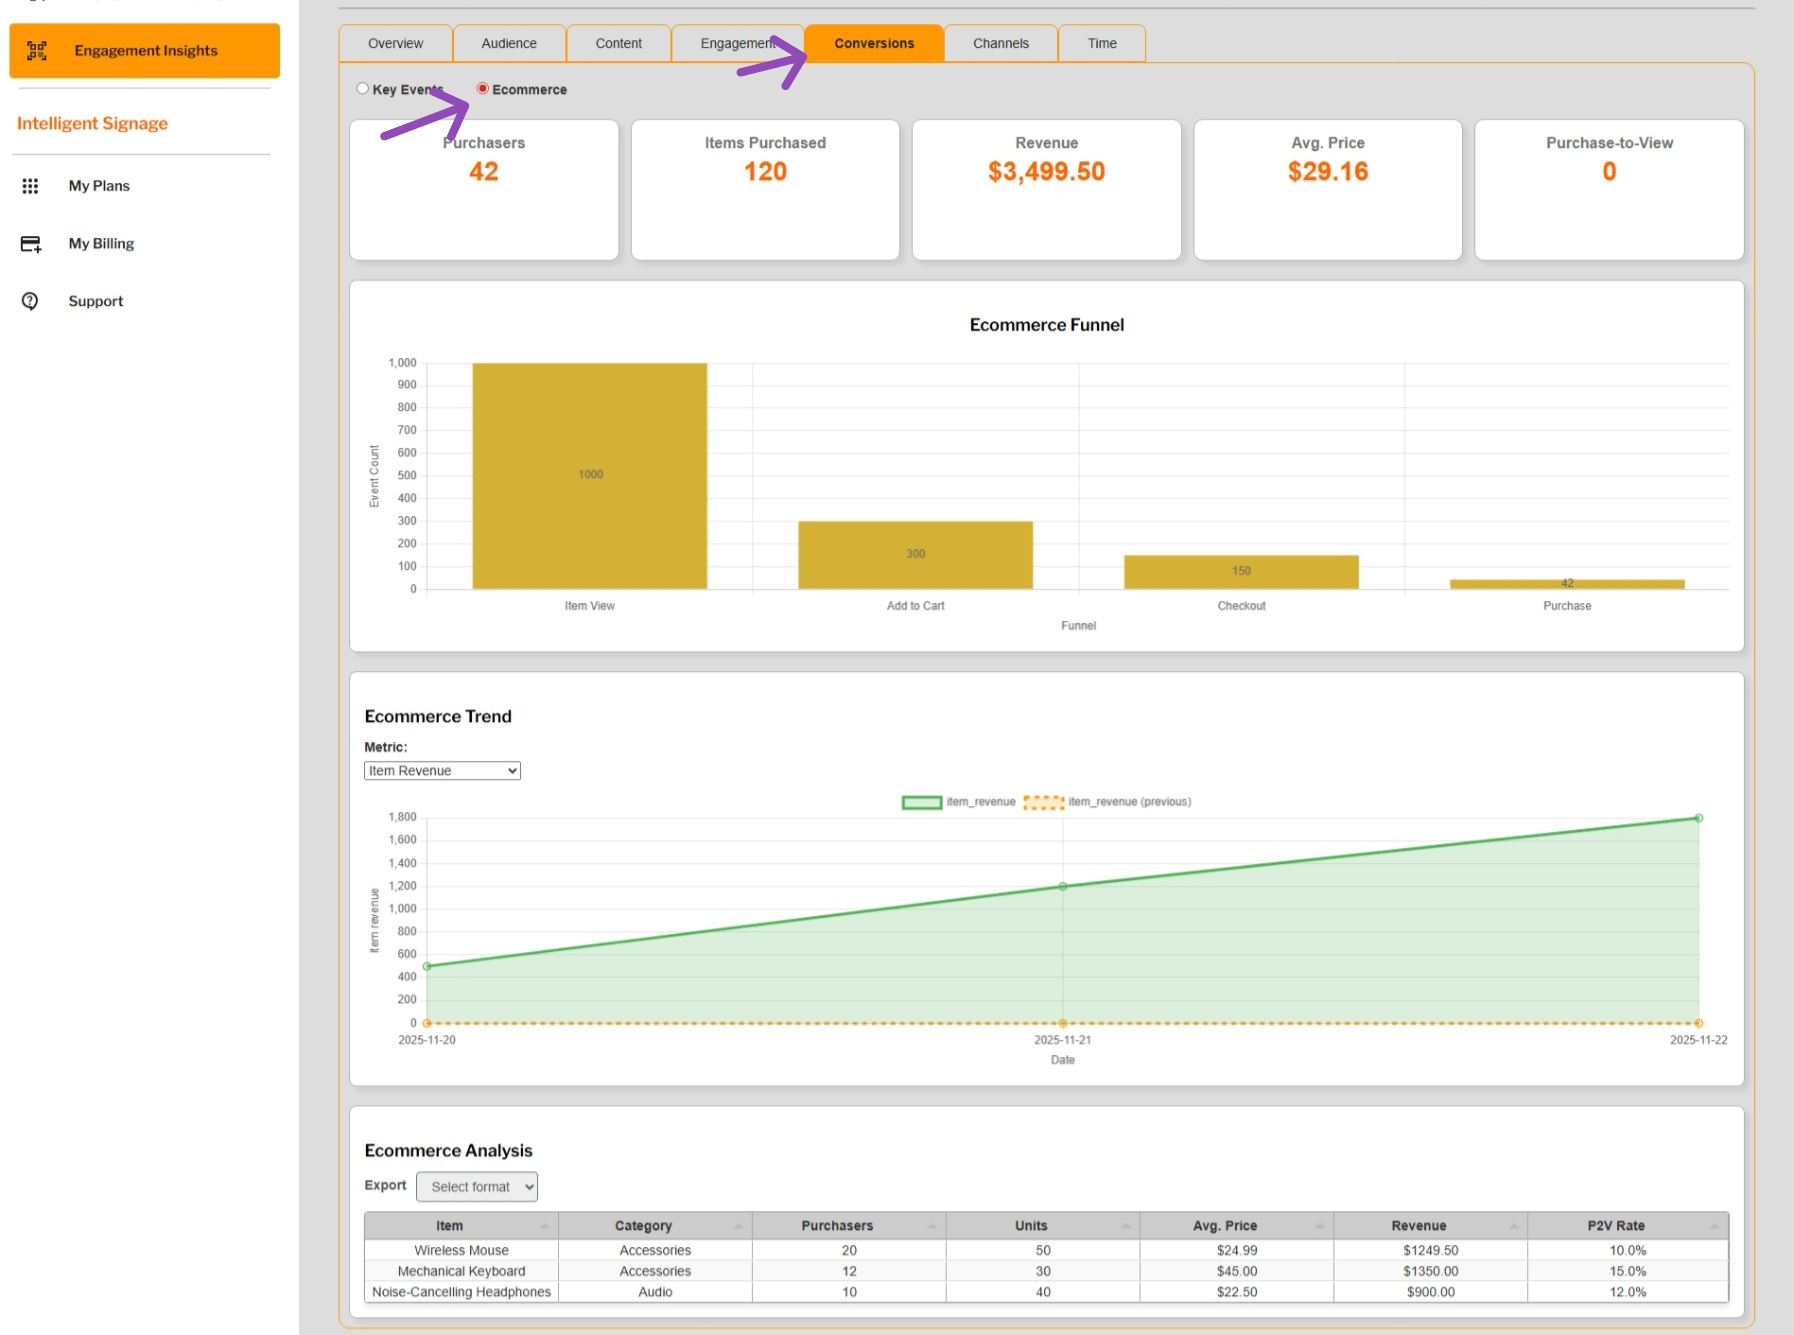
If “Ecommerce” is selected
Cards
- Purchasers
- Items Purchased
- Revenue
- Average Price
- Purchase‑to‑View Rate
Charts
- Ecommerce Funnel (Item View → Add to Cart → Checkout → Purchase)
- Ecommerce Trend
- Metric selector (Revenue, Purchasers, Items Purchased, Avg Price, P2V Rate)
Table
- Item
- Category
- Purchasers
- Units
- Avg Price
- Revenue
- P2V Rate
This tab is essential for businesses tracking sales, revenue, and conversion funnels.
** Demonstration data. The information shown in the example above uses sample content for illustrative purposes only. Actual data, features, and screen layouts may vary based on your subscription tier and account permissions. **
Tab 6 — Channels
This tab shows how users arrive at your landing page.
Radio Buttons
- All Channels
- Owned Channels
- Paid Channels
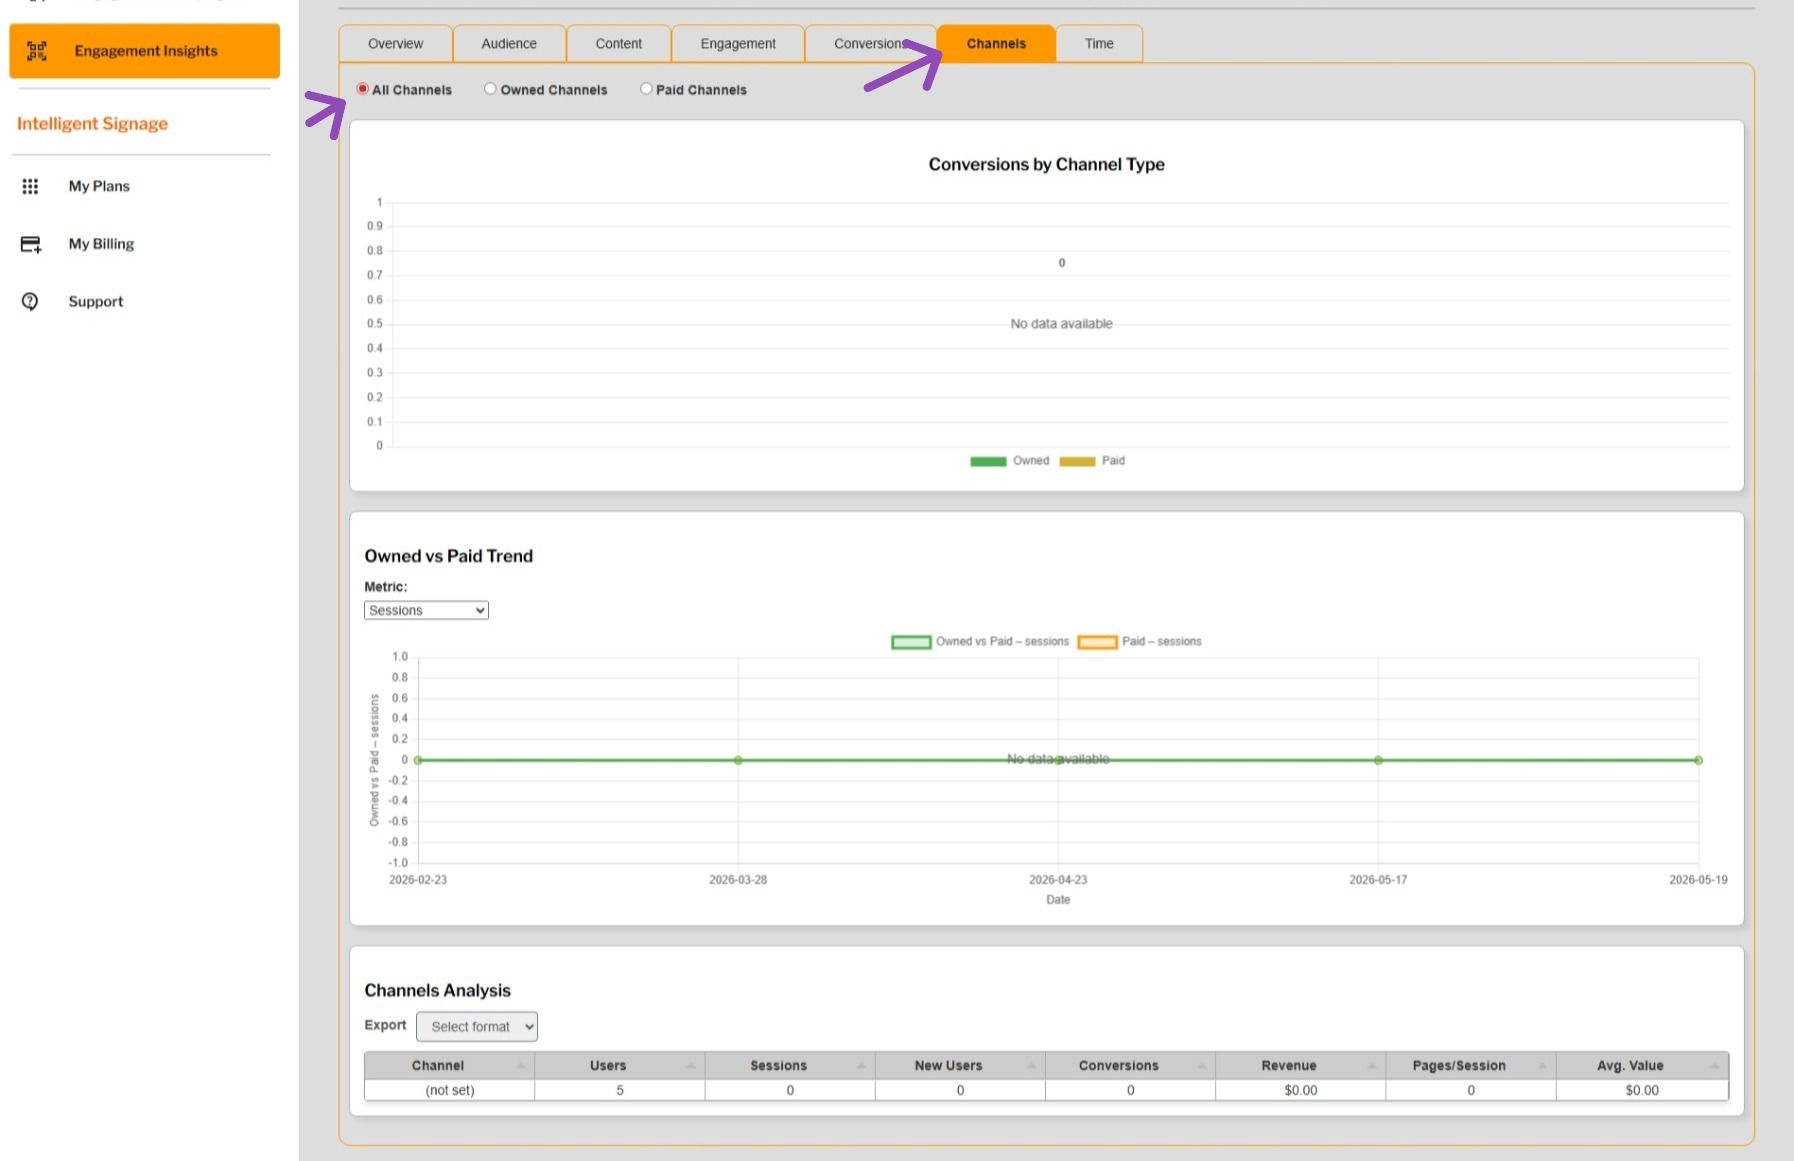
If “All Channels” is selected
Charts
- Conversions by Channel Type (Owned vs Paid)
- Owned vs Paid Trend
- Metric selector (Sessions, Users, Conversions, etc.)
Table
- Channel
- Users
- Sessions
- New Users
- Conversions
- Revenue
- Pages/Session
- Avg Value
** Demonstration data. The information shown in the example above uses sample content for illustrative purposes only. Actual data, features, and screen layouts may vary based on your subscription tier and account permissions. **
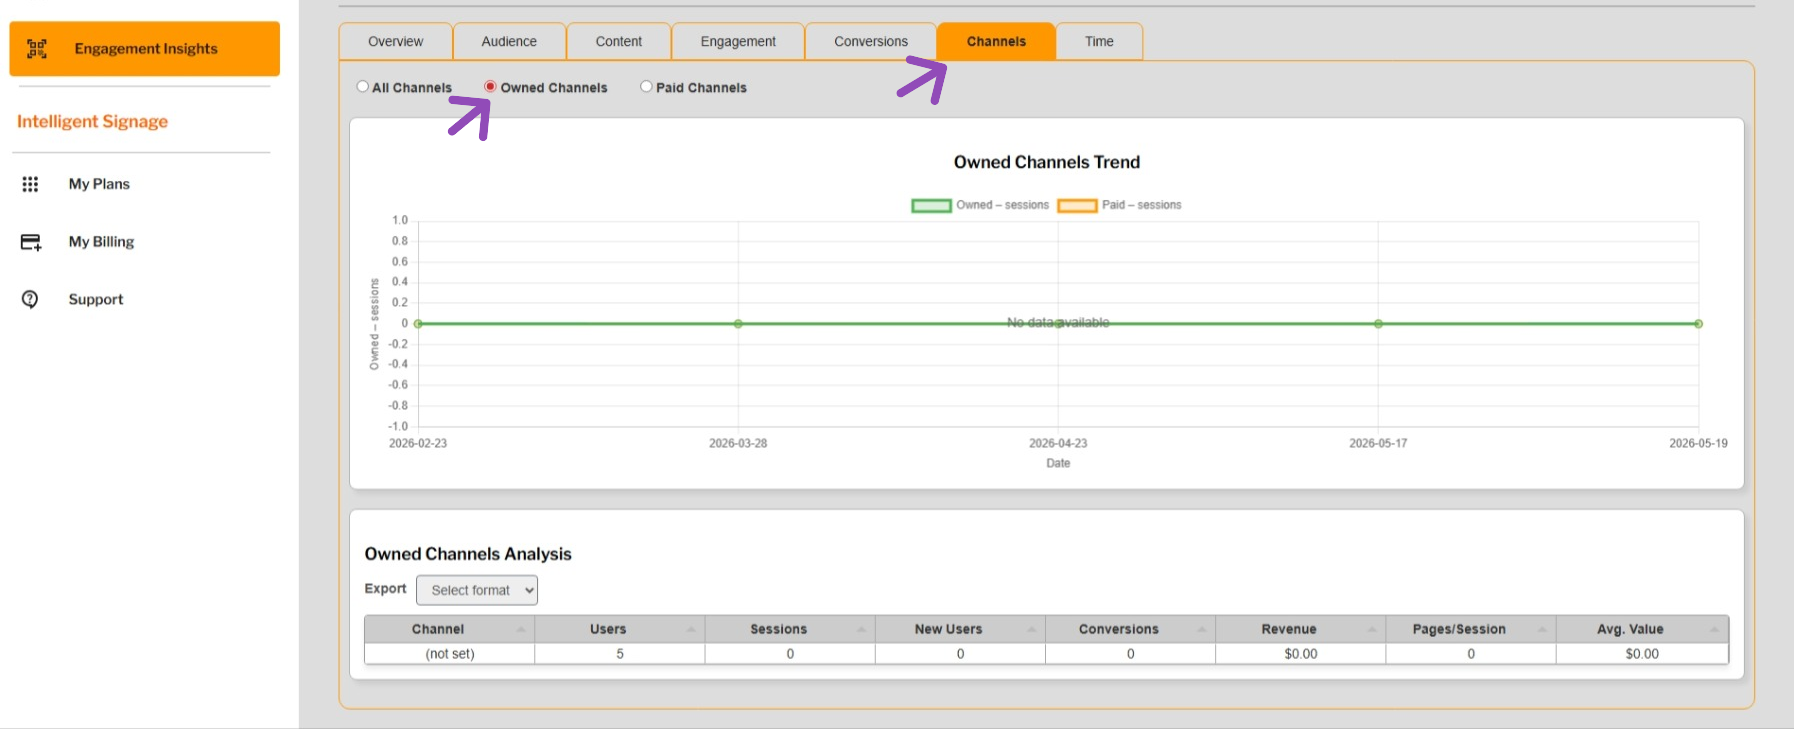
If “Owned Channels” is selected
Charts
- Owned Channels Trend
Table
- Channel
- Users
- Sessions
- New Users
- Conversions
- Revenue
- Pages/Session
- Avg Value
** Demonstration data. The information shown in the example above uses sample content for illustrative purposes only. Actual data, features, and screen layouts may vary based on your subscription tier and account permissions. **
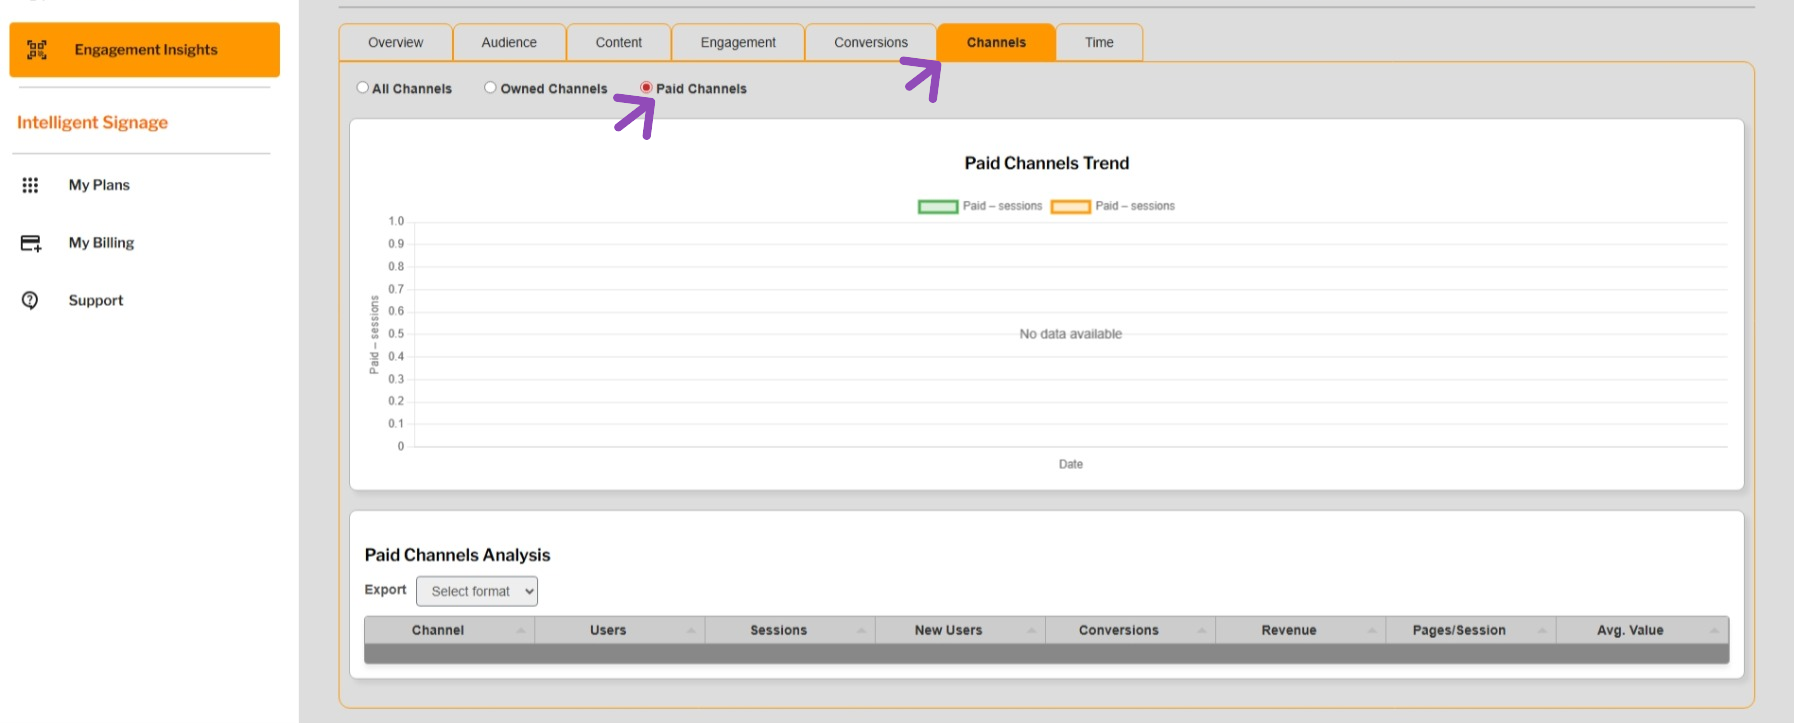
If “Paid Channels” is selected
Charts
- Paid Channels Trend
Table
- Channel
- Users
- Sessions
- New Users
- Conversions
- Revenue
- Pages/Session
- Avg Value
This tab helps you understand which channels drive the most value.
** Demonstration data. The information shown in the example above uses sample content for illustrative purposes only. Actual data, features, and screen layouts may vary based on your subscription tier and account permissions. **
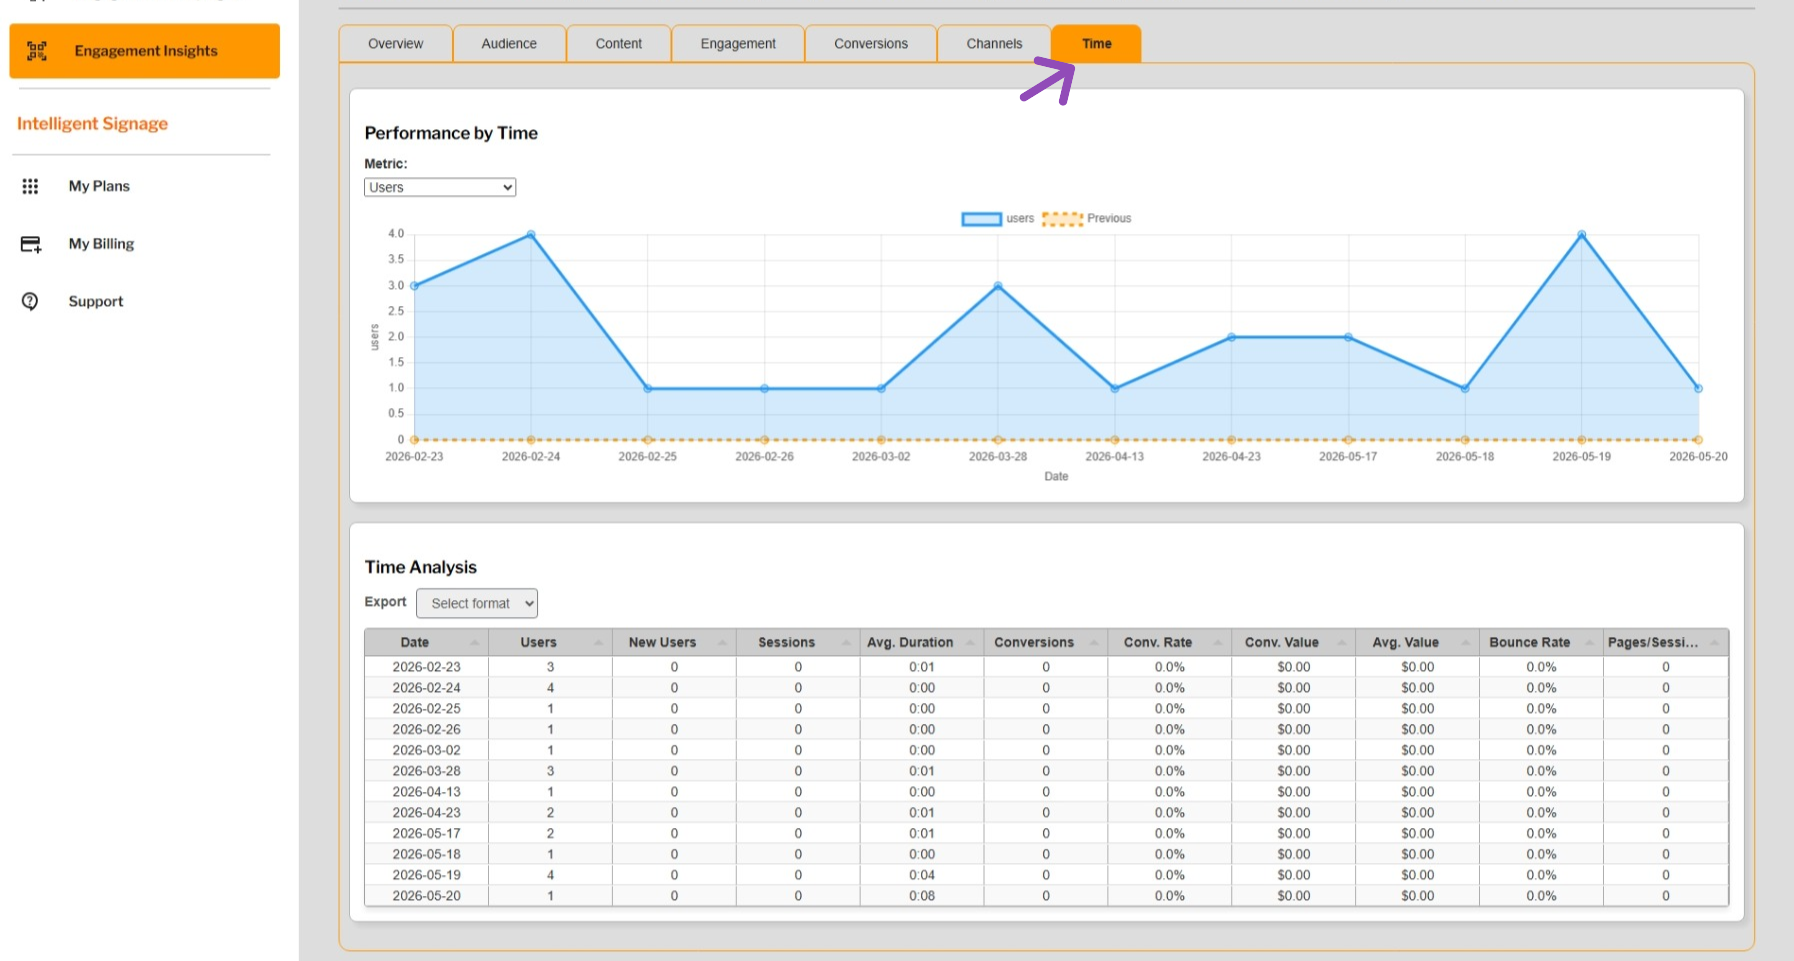
Tab 7 — Time
This tab analyzes performance over time.
Charts
- Performance by Time
- Metric selector (Sessions, Users, Bounce Rate, Conversions, etc.)
Table
- Date
- Users
- New Users
- Sessions
- Avg Duration
- Conversions
- Conversion Rate
- Conversion Value
- Avg Value
- Bounce Rate
- Pages/Session
This tab is ideal for spotting trends, seasonality, and behavioral patterns.
** Demonstration data. The information shown in the example above uses sample content for illustrative purposes only. Actual data, features, and screen layouts may vary based on your subscription tier and account permissions. **
6.3.3 Engagement Metric Definitions
For a definition of the terms / metrics used in the Engagement Insights dashboard, see the Help Center section titled Customer Engagement Analytics: Metric Glossary